How Interest Rates Affect Stocks, Crypto and Gold
Interest rates are the price of money, and almost every financial asset is influenced by them. This guide explains how rates move through stocks, bonds, Bitcoin, gold, housing, currencies and the broader economy.
**
How Interest Rates Affect Stocks, Crypto and Gold
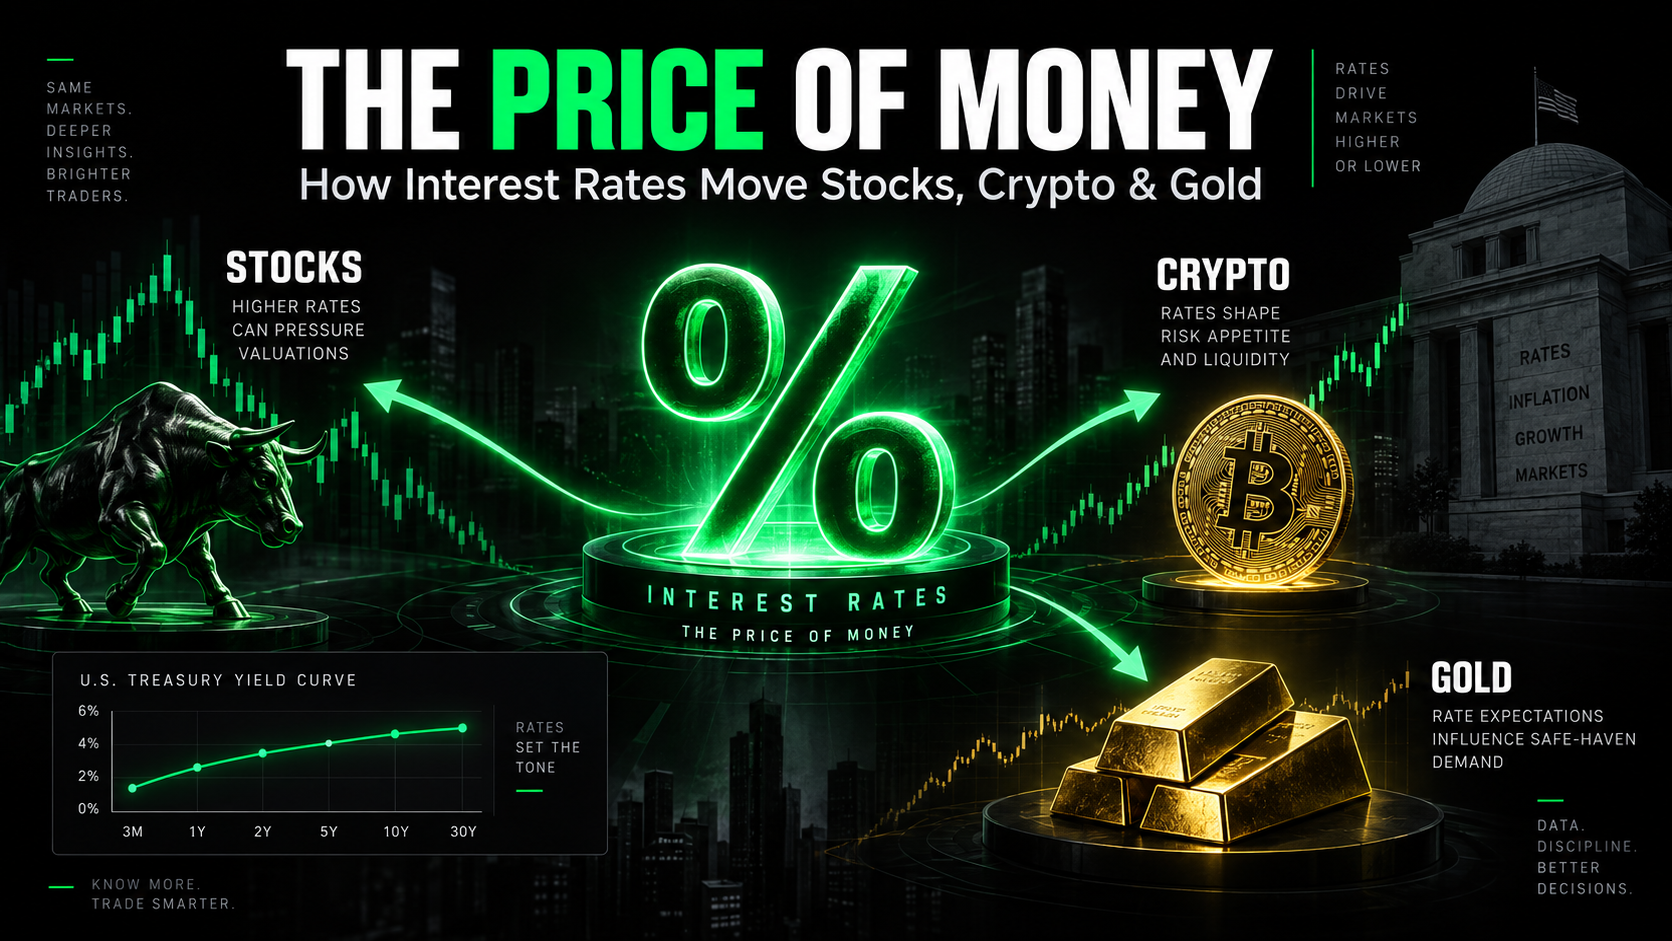
A move in interest rates can change what investors are willing to pay for a technology company, alter the monthly payment on a mortgage, strengthen the US dollar and put pressure on Bitcoin or gold. Those markets may look unrelated on the surface, but they are connected by one of the most important forces in finance: the price of money.
Interest rates sit underneath almost every major financial market because they influence the cost of borrowing, the return available on safer assets and the value investors assign to future cash flows. Understanding how interest rates affect stocks also makes it easier to understand bonds, currencies, crypto, commodities, housing and the broader economy.
This guide breaks down how the system works, how we got here, where rates stand today and what different rate environments could mean in the future. The goal is not to predict the next Federal Reserve decision, but to build a framework traders and investors can use whenever the rate cycle changes.
What Is an Interest Rate?
At its simplest, an interest rate is the price of borrowing money. If someone lends you $100 and you repay $105 one year later, the additional $5 represents a 5% simple cost for using that capital.
The lender is giving up the ability to use the money today, so they generally expect to be compensated for time, inflation and risk. That same concept applies whether we are talking about a credit card balance, a corporate bond, a mortgage or trillions of dollars of US government debt.
Interest rates also influence the return investors can earn without owning stocks or other volatile assets. When safe government securities begin paying 4% or 5%, every risky investment effectively has a higher hurdle to clear.
Why Interest Rates Are Often Called the Price of Money
Money has a cost because capital is limited and people value money today more than the same amount received years from now. Inflation also reduces purchasing power over time, while uncertainty creates the possibility that a borrower may fail to repay what they owe.
A financially strong government can normally borrow at a lower rate than a speculative corporation because investors perceive less credit risk. Longer loans can also require additional compensation because investors are committing their money for more time and taking greater inflation and interest-rate risk.
This means there is no single interest rate controlling the economy. There is an entire interest-rate system, with different rates reflecting different maturities, risks and expectations.
The Interest Rates Traders Should Know
The Federal Reserve receives most of the headlines, but the Fed's policy rate is only one piece of the system. Traders should understand the relationship between short-term monetary policy and the market-driven yields available across the Treasury curve.
As of the latest available data, the Fed's target range remains 3.50% to 3.75%, while the market is demanding higher yields on two-year and ten-year government debt. The spread between policy rates and longer-term market rates is one reason simply saying "rates are at 3.75%" does not accurately describe current financial conditions.
Rate or Indicator | Current Level | Why It Matters |
Federal funds target | 3.50% to 3.75% | Current Fed policy stance |
US 2-year Treasury | ~4.37% | Highly sensitive to near-term Fed expectations |
US 10-year Treasury | ~4.78% | Major benchmark for valuations and borrowing costs |
30-year fixed mortgage | 6.71% | Shows how financial conditions reach households |
Headline PCE inflation | 3.7% YoY | Fed's preferred broad inflation measure |
Core PCE inflation | 3.3% YoY | Inflation excluding food and energy |
Fed inflation objective | 2% | Longer-run price-stability target |
The Federal Reserve maintained its target at 3.50% to 3.75% in July, but the decision was not unanimous. Three FOMC members preferred a 25-basis-point increase, which is important context for a market now debating whether another hike could be required.
What Is the Federal Funds Rate?
The federal funds rate is an overnight interest rate associated with reserve balances in the banking system. The Federal Open Market Committee sets a target range and uses monetary-policy tools to keep overnight rates consistent with that target.
Although the rate itself is extremely short term, changes in Fed policy can influence expectations throughout the financial system. Banks, bond traders, businesses, households and global investors all adjust their decisions based partly on where they believe Fed policy is headed.
The Fed's broader mandate is to promote maximum employment and stable prices. With July PCE inflation still running at 3.7% YoY, compared with the Fed's 2% longer-run objective, policymakers continue to face an inflation problem even after substantial easing from the peak policy rate.
The Fed Does Not Control Every Interest Rate
One of the most common misconceptions is that the Federal Reserve directly sets mortgage rates, Treasury yields and corporate borrowing costs. The Fed has enormous influence over financial conditions, but markets determine many longer-term rates through supply, demand and expectations.
The 2-year Treasury yield tends to react strongly to expectations for Fed policy over the next several years. The 10-year Treasury yield incorporates a much broader set of forces, including expected inflation, long-term growth, future Fed policy, Treasury supply, fiscal conditions and compensation for holding long-duration debt.
That is why the Fed can cut its overnight rate while the 10-year Treasury moves higher. It is also why a trader who follows only FOMC decisions can miss important changes happening elsewhere in the financial system.
How Bonds and Interest Rates Work
A bond is essentially a loan that can be bought and sold. An investor lends money to a government or corporation and receives agreed interest payments, with the principal typically returned at maturity.
The market value of that bond can change before maturity because newly issued bonds are constantly competing with older ones. This creates one of the most important relationships in finance: bond prices and bond yields generally move in opposite directions.
Why Bond Prices Fall When Interest Rates Rise
Imagine you own a $1,000 bond paying 3% interest, which means it generates $30 annually. If newly issued bonds suddenly pay 4%, investors have little reason to pay you the full $1,000 for a security providing only $30 when they can receive $40 from a new one.
The price of your older bond therefore falls until its effective yield becomes competitive with current market rates. If new rates fall below your existing coupon instead, your higher-paying bond becomes more attractive and its market price can rise.
The SEC uses this relationship when explaining interest-rate risk to investors. Its educational material demonstrates that a fixed-rate bond can lose meaningful market value when prevailing interest rates rise.
Market Environment | Existing Bond Coupon | New Market Rate | Approx. Value |
Starting point | 3% | 3% | $1,000 |
Rates fall | 3% | 2% | $1,082 |
Rates rise | 3% | 4% | $925 |
The important lesson is not the exact price in this example. The lesson is that investors continuously reprice existing assets when the return available on newly issued securities changes.
Duration Explains Why Some Assets React More
Duration measures how sensitive a bond is to changing interest rates. Generally, the longer investors must wait to receive the majority of an asset's cash flows, the more sensitive its value becomes to changes in the discount rate.
This concept starts in fixed income, but it is also useful when thinking about stocks. A mature business producing significant cash today is financially different from a growth company whose valuation depends heavily on profits expected five, ten or fifteen years from now.
That helps explain why long-duration technology and growth stocks can react violently when Treasury yields move. Investors are effectively changing the value they place on earnings that may not arrive for years.
How Interest Rates Affect Stocks
Understanding how interest rates affect stocks starts with a simple idea: the value of a business depends partly on the cash that business is expected to generate in the future. Investors then have to determine what those future dollars are worth today.
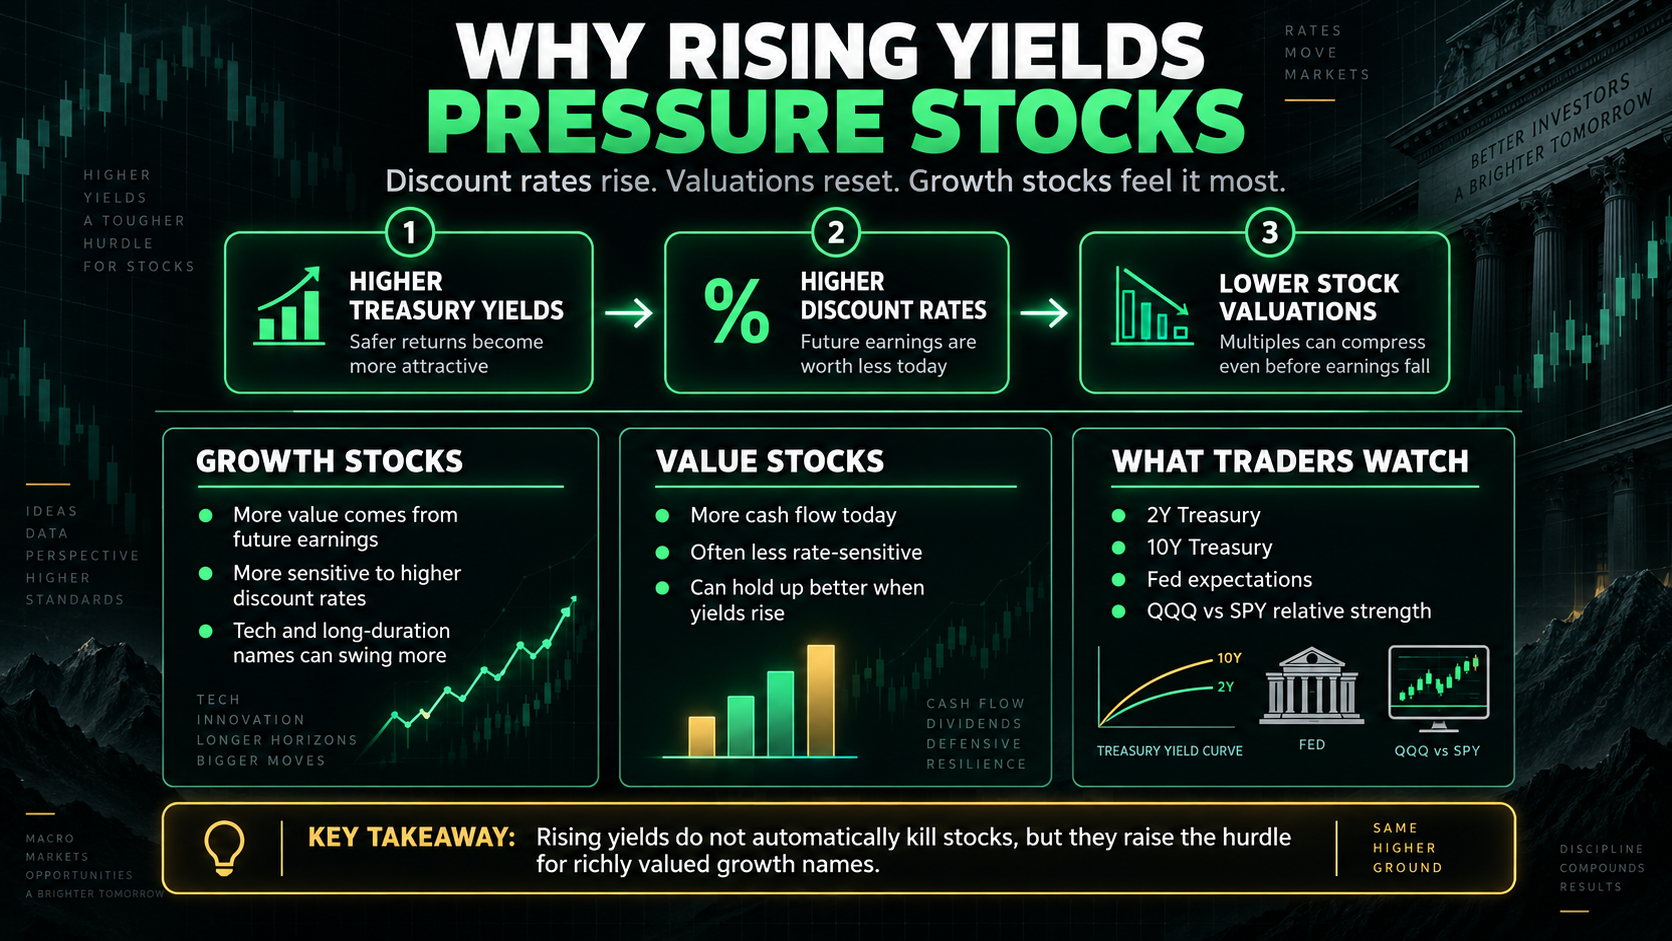
This process is called discounting, and interest rates influence the discount rate used in that calculation. When safer interest rates rise, investors can demand a higher expected return from stocks, which can reduce the price they are willing to pay for future corporate earnings.
A Simple Valuation Example
Assume an investment is expected to produce $100 five years from now. The amount of money received is identical in every example below, but its estimated present value changes dramatically as the discount rate rises.
Discount Rate | Present Value of $100 in 5 Years |
2% | $90.57 |
5% | $78.35 |
8% | $68.06 |
Nothing about the future $100 changed in that calculation. What changed was the return an investor required in exchange for waiting five years to receive it, which is why valuation multiples can fall even before a company's actual earnings deteriorate.
Why Growth and Technology Stocks Can Be More Sensitive
Growth companies often receive a greater portion of their valuation from earnings expected far into the future. When interest rates rise, the present value of those distant earnings can fall more sharply than the value of cash flows expected much sooner.
This helps explain why rate volatility can have an outsized effect on the Nasdaq-100 and $QQQ. A company can still be growing revenue and earnings while its stock falls because investors are suddenly willing to pay a lower multiple for those future profits.
The 2022 tightening cycle offered a powerful example. The Nasdaq-100 produced a -32.38% total return in 2022, while the S&P 500 returned -18.11%, during a year when the Fed was aggressively increasing interest rates and markets were repricing long-duration assets.
The 2020 Market Showed the Other Side
The opposite environment appeared during the pandemic. In March 2020, the Fed reduced its target range to 0% to 0.25%, creating an extraordinarily low-rate environment alongside large-scale monetary and fiscal support.
The Nasdaq-100 generated a 48.88% total return in 2020, while the S&P 500 returned 18.40%. Low rates were not the only reason markets rallied, but cheaper capital, lower discount rates and enormous liquidity helped create an environment that was highly supportive of long-duration assets.
Comparing 2020 with 2022 helps show why the cost of money matters. Asset prices respond not only to corporate performance, but also to the financial environment in which investors are valuing that performance.
How Interest Rates Affect AI Stocks
Today's AI boom makes this relationship especially relevant. Building data centers, purchasing chips, expanding electrical infrastructure and training advanced models require enormous amounts of capital, which means the cost of financing increasingly matters to the economics of AI investment.
Companies such as $NVDA, $MSFT, $GOOGL, $AMZN and $META can continue growing despite high rates if earnings and cash flow are strong enough. The challenge is that higher Treasury yields increase the hurdle rate investors use to decide what those future earnings are worth today.
This is why a strong technology company can report excellent results and still see its stock fall during a sharp bond-market selloff. The underlying business can remain healthy while the valuation environment becomes less generous.
Why Small Caps Can Feel Higher Rates More Quickly
Small companies often have less financial flexibility than large-cap corporations. They may rely more on bank financing, floating-rate loans, shorter debt maturities or repeated access to capital markets.
If borrowing costs climb from 4% to 7%, the impact can become meaningful for a business operating on thin margins. That helps explain why traders watching $IWM should pay attention not only to Fed policy, but also to credit conditions and Treasury yields.
Lower rates can provide a meaningful tailwind if they reduce financing costs and improve access to capital. Higher rates can create the opposite effect, especially when they arrive alongside weaker economic growth.
Higher Rates Can Reduce Corporate Earnings Directly
Interest rates do not affect stocks only through valuation multiples. They can also reduce the actual earnings a company produces by increasing interest expense.
Imagine a company carrying $1 billion of debt that needs to be refinanced. A 3% borrowing cost creates approximately $30 million in annual interest expense, while a 6% cost creates approximately $60 million.
The company now spends an additional $30 million per year to finance the same amount of debt. That money can no longer be used for hiring, investment, acquisitions, dividends, share repurchases or other corporate priorities.
How Interest Rates Affect Bitcoin and Crypto
Bitcoin does not generate earnings or traditional cash flow, so the same valuation model used for a company does not translate neatly to BTC. Interest rates still matter because crypto competes for capital in the same global financial system as stocks, bonds, cash and commodities.
When Treasury bills offer almost no yield, investors receive little compensation for sitting in safer assets. When government debt offers 4% or 5%, the opportunity cost of owning an asset with no cash yield becomes more significant.
Research from the International Monetary Fund found that US monetary tightening can reduce a broad crypto-market factor through a risk-taking channel similar to the one seen in equities. The research also found that crypto's relationship with global equity markets strengthened as institutional participation increased.
Why Liquidity Matters So Much to Crypto
Crypto markets tend to respond strongly to changes in liquidity and risk appetite. Easy financial conditions can make leverage cheaper, reduce the attractiveness of cash and encourage investors to move further out on the risk spectrum.
Tighter monetary conditions can reverse that process by increasing financing costs and making safer assets more competitive. Investors may reduce leverage, demand higher expected returns or move capital away from speculative positions.
This does not mean Bitcoin falls every time rates rise or rallies every time rates fall. Crypto-specific factors such as ETF flows, regulation, adoption, network activity, leverage and supply dynamics can overpower the macro relationship for long periods.
Bitcoin Can Behave Like Two Different Assets
Bitcoin is often described as both a speculative risk asset and a potential alternative monetary asset. Those two narratives can create very different reactions depending on what is driving interest rates.
When rates rise because the economy is strong and liquidity is tightening, BTC can behave more like a high-volatility risk asset. When investors become concerned about currency debasement, government debt or aggressive monetary expansion, Bitcoin's capped supply can support a different argument.
The Bitcoin protocol caps total supply at 21 million BTC, which is central to its scarcity thesis. Traders therefore need to understand the market regime rather than relying on a simple rule that higher rates are always bearish or lower rates are always bullish for Bitcoin.
How Interest Rates Affect Gold
Gold is another asset where simple rules often fail. Inflation can support gold, but inflation by itself does not determine the direction of the metal.
Gold produces no interest income, so investors also compare it with the real return available from bonds and cash. That is why real yields, which account for inflation, are so important when analyzing gold.
A simplified way to think about the relationship is:
Nominal interest rate - expected inflation = approximate real interest rate
If a Treasury yields 5% while expected inflation is 2.5%, the approximate real return is positive 2.5%. If the Treasury yields 2% while expected inflation is 3%, the approximate real return is negative 1%.
Why Higher Real Yields Can Pressure Gold
Positive real yields give investors an opportunity to earn purchasing-power-adjusted returns from an interest-bearing asset. Because gold itself does not generate income, higher real yields can increase the opportunity cost of holding it.
The World Gold Council continues to identify real yields, monetary-policy expectations and the dollar as important factors affecting investment demand. Its 2026 outlook also notes that higher real yields can restrain ETF demand even when other factors remain supportive.
The relationship is not perfect because gold is influenced by several additional forces. Central-bank buying, geopolitical uncertainty, physical demand and concerns about currencies or sovereign debt can support gold even when rates remain restrictive.
Central Banks Have Changed the Gold Equation
Central banks purchased approximately 289 tonnes of gold in Q2 2026, up 62% YoY, according to the World Gold Council. First-half net purchases totaled about 345 tonnes, demonstrating that official-sector demand remains an important part of the modern gold market.
A June World Gold Council survey found that 89% of reserve managers expected global central-bank gold holdings to increase during the following 12 months. A record 45% said they expected their own institutions to increase gold holdings.
That structural demand helps explain why "rates up, gold down" is not a reliable standalone trading rule. Gold responds to the entire monetary and geopolitical environment rather than one interest-rate number.
What Gold Is Doing in the Current Rate Environment
The latest market action provides a useful real-time example. After stronger US employment data on September 4 increased expectations for another Fed hike, the 2-year Treasury yield rose to about 4.37%, the dollar strengthened and spot gold fell roughly 1.2% to $4,419.09 per ounce.
That is a fairly traditional short-term reaction because stronger economic data increased expectations for tighter policy and higher yields. It should not be interpreted as proof that gold will always fall when rates rise, particularly when geopolitical and central-bank demand remain significant.

How Interest Rates Affect the US Dollar
Currencies are always priced relative to other currencies, which makes interest-rate differentials extremely important. If US securities suddenly offer meaningfully higher yields than comparable securities abroad, international investors can have more incentive to own dollar-denominated assets.
That increased demand can strengthen the US dollar, especially when markets expect American rates to stay higher for longer than rates in other major economies. The effect can then spread well beyond the foreign-exchange market.
A stronger dollar can create a headwind for dollar-priced commodities and affect the overseas earnings of US multinational companies. It can also tighten global financial conditions because large amounts of international trade and debt are denominated in dollars.
How Interest Rates Affect Housing
Housing is one of the clearest examples of financial-market rates reaching everyday households. The Federal Reserve does not directly set the 30-year mortgage rate, because mortgages are influenced by longer-term Treasury yields, mortgage-backed securities, credit conditions and lender spreads.
Freddie Mac reported that the average US 30-year fixed mortgage rate was 6.71% on September 3, 2026, compared with 6.50% one year earlier. The average 15-year fixed rate was 6.04%.
Small differences in rates can produce significant differences in affordability when applied to a large mortgage balance.
30-Year Mortgage Rate | Approx. Payment on $300,000 |
6.5% | $1,896/month |
7.0% | $1,996/month |
7.5% | $2,098/month |
8.0% | $2,201/month |
Moving from 6.5% to 8% adds roughly $305 per month, or about $3,660 annually, to principal and interest on a $300,000 mortgage. That calculation does not include property taxes, insurance, maintenance or other housing expenses.
Why Housing Rates Matter to Stock Traders
Higher mortgage rates can pressure home affordability and transaction volumes, which directly affects homebuilders and housing-related ETFs such as $XHB and $ITB. The economic effects also spread into mortgage lenders, banks, real estate brokers, furniture companies, appliance manufacturers and building-material suppliers.
Housing is highly interconnected with consumer spending because buying a home often triggers additional purchases and financing activity. When higher rates reduce housing turnover, the impact can therefore reach well beyond residential real estate.
How Interest Rates Affect Banks
Banks can benefit from rising rates because interest earned on loans and securities may increase. At the same time, banks must compete for deposits, manage credit risk and absorb changes in the market value of bonds already held on their balance sheets.
The 2022 tightening cycle demonstrated that balance-sheet risk clearly. US banks reported $620.4 billion of unrealized losses on securities in Q4 2022, including approximately $340.9 billion on held-to-maturity securities and $279.5 billion on available-for-sale securities.
This is why higher rates are not automatically bullish for $JPM, $BAC, $C or $WFC. Investors need to consider net interest margins, deposit costs, bond duration, loan demand and credit losses together.
Why Interest Rates Matter to Government Debt
The federal government is one of the largest borrowers in the world, so higher interest rates can have enormous budget consequences. Treasury debt regularly matures and must often be refinanced, which means higher yields can gradually increase the government's overall interest expense.
The Congressional Budget Office projects $1.0 trillion of net federal interest outlays in fiscal 2026, rising to approximately $2.1 trillion by 2036 under its baseline assumptions. Net interest costs are projected to rise from 3.3% of GDP to 4.6% of GDP over the same period.
CBO also projects a $1.9 trillion federal deficit in 2026 and debt held by the public equal to approximately 101% of GDP. Under its current baseline, that debt ratio reaches roughly 120% by 2036.
Why Government Borrowing Can Affect Long-Term Rates
More government borrowing usually means more Treasury securities must be sold to investors. If buyers demand additional compensation to absorb that supply, long-term yields can remain elevated even if the Fed eventually reduces short-term rates.
This creates an important distinction for investors. The Fed can control the overnight policy environment, but it cannot force long-term investors to accept a 3% yield if those investors believe inflation, fiscal risk or Treasury supply justify 5%.
That is one reason today's market increasingly focuses on both monetary policy and fiscal policy. The cost of government borrowing can influence everything from mortgage rates to equity valuations.
A Short History of Interest Rates and Markets
Understanding the present requires some historical context because the ultra-low rates of the 2010s were not normal across every period. US financial history includes both double-digit yields and periods when the policy rate was effectively zero.
The most useful episodes show how the same mechanism can operate in very different directions. High inflation can force rates sharply higher, while recessions and financial crises can push central banks toward aggressive easing.
1979 to 1982: Volcker Breaks Inflation
Inflation became deeply embedded in the US economy during the 1970s, creating one of the most difficult monetary-policy environments in modern history. Paul Volcker became Fed chair in 1979 and made restoring price stability the central priority.
Federal Reserve History says the federal funds rate rose from approximately 11% when Volcker took office to a peak of 19% in 1981. Twelve-month inflation subsequently declined from nearly 15% at its peak to approximately 4% by the end of 1982.
The cost was severe, including recession and substantial unemployment. The episode remains one of the clearest examples of how aggressively a central bank may tighten when it believes inflation psychology has become entrenched.
2007 to 2008: From High Rates to Emergency Policy
The Global Financial Crisis required the opposite response. As the housing market collapsed and financial stress intensified, the Fed reduced the federal funds rate from 5.25% in September 2007 to 0% to 0.25% by December 2008.
Once rates approached zero, conventional monetary policy had much less room to operate. The Fed increasingly turned toward balance-sheet tools and other emergency measures, helping establish the monetary-policy playbook that would later return during the pandemic.
This period also showed an important lesson for traders: falling rates are not automatically bullish. When rates are collapsing because the financial system is in crisis, deteriorating earnings and credit conditions can initially overwhelm the benefit of cheaper money.
2020: Money Becomes Almost Free Again
The pandemic forced another emergency easing cycle. The Fed began 2020 with a target range of 1.50% to 1.75% and reduced it to 0% to 0.25% by March 16 as the economic shutdown intensified.
Low rates were paired with extraordinary fiscal support and central-bank interventions, creating extremely loose financial conditions after the initial crash. The S&P 500 ultimately returned 18.40% in 2020, while the Nasdaq-100 returned 48.88%.
This period reinforced an important market lesson. When the return on safe cash and government bonds approaches zero, investors have a stronger incentive to move further out on the risk spectrum.
2022 to 2023: Inflation Forces the Fed to Reverse Course
The inflation shock that followed forced one of the fastest monetary-policy reversals in decades. Beginning in March 2022, the Fed raised its target range by a cumulative 525 basis points, eventually reaching 5.25% to 5.50% in July 2023.
Financial markets suddenly had to adjust from almost-free money to an environment where cash and government debt offered meaningful yields. In 2022, the Nasdaq-100 returned -32.38% and the S&P 500 returned -18.11%, while mortgage rates and borrowing costs surged.
Rates were not responsible for every market move during that period, but they changed the fundamental pricing environment. Investors had to rethink what they were willing to pay for growth, leverage and risk.
2024 to 2026: Easing, Then Another Inflation Problem
The Fed began reducing rates in September 2024, including an initial 50-basis-point cut, followed by additional reductions during late 2024 and 2025. By December 2025, the target range had reached 3.50% to 3.75%, where it remained through the July 2026 meeting.
The complication is that inflation has not returned sustainably to target. July 2026 PCE inflation was 3.7% YoY, while core PCE excluding food and energy was 3.3%, leaving both measures materially above the Fed's 2% objective.
That has brought the market back into a debate that seemed unlikely only a short time ago: whether the Fed may need to raise rates again after already cutting them substantially from the 2023 peak.
Where Interest Rates Stand Today
The current market is unusual because short-term policy rates have fallen from their peak, yet longer-term borrowing costs remain elevated. The 10-year Treasury ended September 4 near 4.78%, while the 2-year was around 4.37%, and the average 30-year mortgage remains above 6.7%.
At the same time, the US economy added 162,000 jobs in August, far above the roughly 56,000 expected by economists, while unemployment remained at 4.1%. That stronger labor-market report increased the possibility that the Fed could tighten policy again rather than continuing the easing cycle.
As of Friday's close, interest-rate futures were pricing roughly a 57% probability of a September rate increase, after that probability moved as high as about 65% during the session. The Fed meets on September 15 and 16, with August CPI scheduled for September 11, meaning inflation remains the major variable capable of shifting expectations before the decision.
Why Good Economic News Can Be Bad Market News
A strong economic report sounds positive because it suggests businesses are hiring and consumers may remain resilient. Financial markets can interpret the same report negatively if stronger growth makes persistent inflation more likely.
That creates a familiar transmission mechanism: stronger economic data can increase expectations for tighter Fed policy, which can push Treasury yields higher and pressure equity valuations. The market is not deciding whether the data is "good" or "bad" in isolation, it is recalculating the future price of money.
This is exactly what happened after the September 4 jobs report. Treasury yields and the dollar rose while US equities finished lower, with the Dow down 0.51%, the S&P 500 down 0.38% and the Nasdaq down 0.29%.
How Interest Rates Move Through the Entire Market
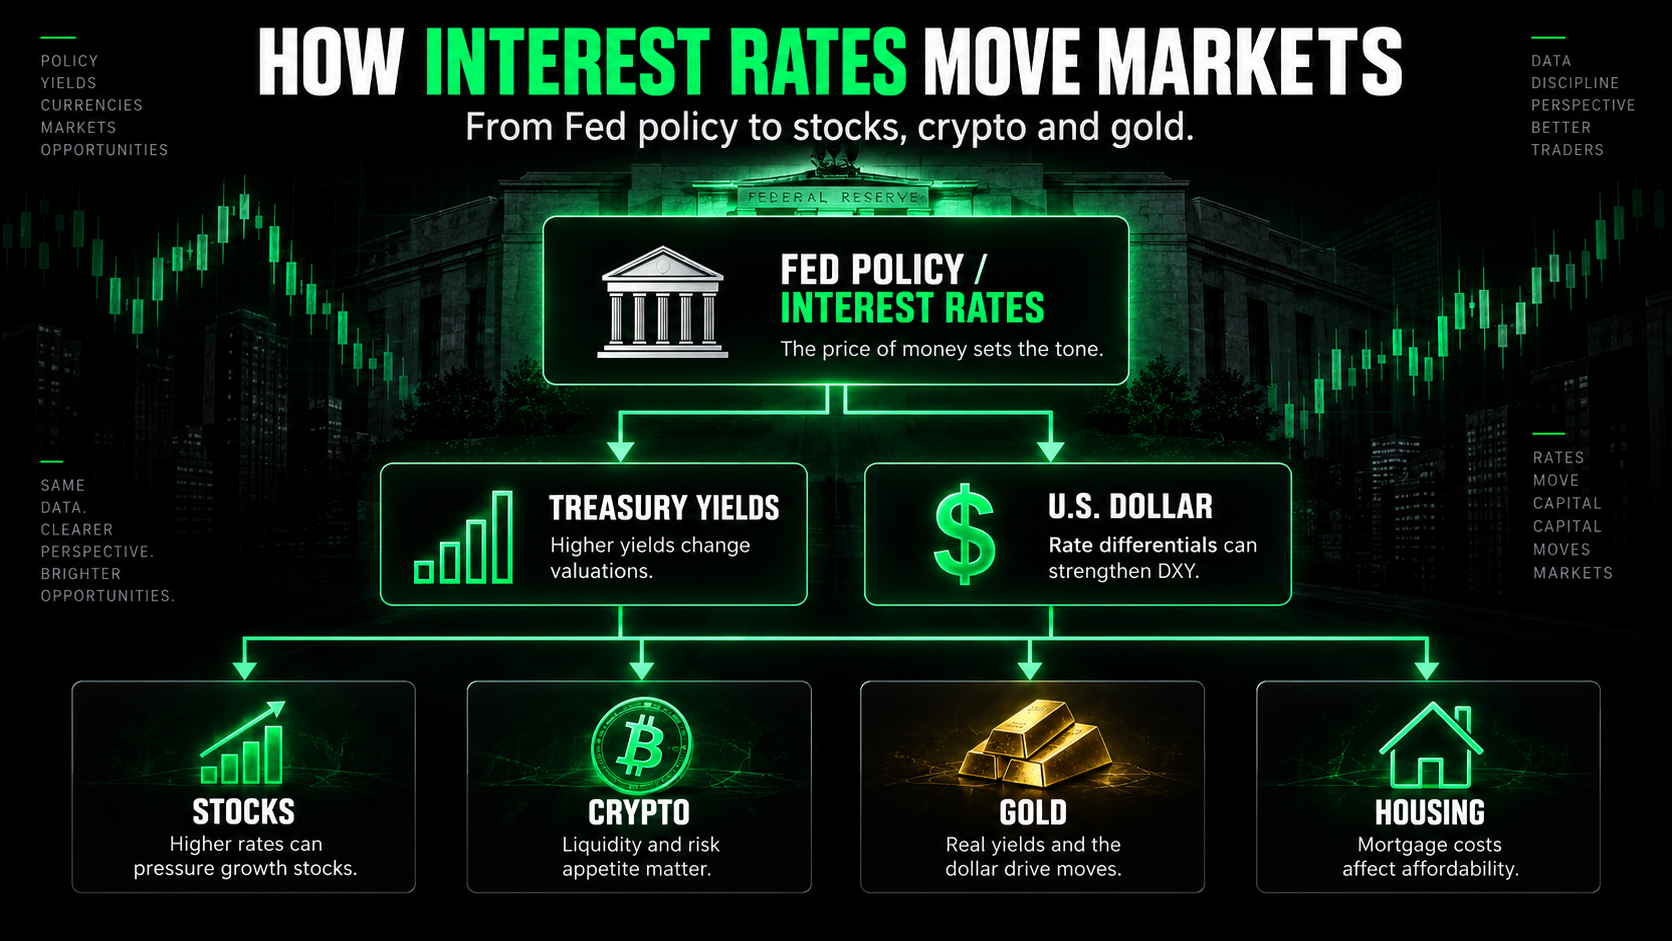
The relationship between monetary policy and financial assets is easiest to understand as a transmission system. Not every step occurs every time, but the framework helps explain why one inflation report can suddenly affect stocks, bonds, currencies, commodities and crypto at the same time.
Starting Point | Potential Market Transmission |
Inflation rises | Fed becomes more hawkish |
Fed expectations rise | Short-term Treasury yields rise |
Bond prices fall | Market yields rise |
Treasury yields rise | Safe assets become more competitive |
Discount rates rise | Stock valuations can compress |
Borrowing costs rise | Corporate investment can slow |
Mortgage rates rise | Housing affordability falls |
US yields rise relative to peers | Dollar may strengthen |
Real yields rise | Gold can face opportunity-cost pressure |
Liquidity tightens | Bitcoin and speculative assets can weaken |
Growth eventually slows | Inflation may begin cooling |
Inflation cools | Fed gains more room to ease |
The key word in that table is potential. Markets are complex systems, and oil shocks, wars, corporate earnings, positioning, fiscal policy and investor psychology can alter or even temporarily reverse the normal relationships.
What Traders and Investors Should Watch
Watching the Fed alone is not enough because markets continuously price future policy before the central bank acts. A useful macro dashboard should combine policy expectations, Treasury yields, inflation, employment, currencies and credit conditions.
Indicator | What It Helps Explain |
Fed funds expectations | Where markets think policy is heading |
2-year Treasury | Near-term Fed and inflation expectations |
10-year Treasury | Long-term growth, inflation and valuation environment |
10-year real yield | Opportunity cost for gold and long-duration assets |
DXY | Global demand for dollars |
CPI | Consumer inflation pressure |
PCE | Fed's preferred inflation framework |
Payrolls and unemployment | Strength of the labor market |
Wage growth | Potential labor-driven inflation |
Credit spreads | Financial stress and corporate borrowing risk |
Mortgage rates | How tightening reaches households |
Yield curve | Relationship between short and long-term expectations |
The objective is not to predict every economic release correctly. The objective is to determine whether financial conditions are becoming easier or tighter and understand which parts of the market are most exposed to that change.
What Could Interest Rates Do Next?
Nobody knows the exact path of rates, and a serious market framework should not pretend otherwise. Scenario analysis is more useful because it allows traders and investors to prepare for several possible environments instead of depending on one forecast.
Scenario 1: Inflation Cools and Rates Fall
If inflation moves convincingly toward 2% while economic growth remains manageable, the Fed could eventually resume easing. Short-term yields would likely decline, financial conditions could improve and lower discount rates could support long-duration assets.
Technology stocks and other growth companies could benefit from the valuation effect, while small caps could receive additional support from cheaper financing. Bitcoin could also benefit if easier policy improves liquidity and reduces the return available on safe assets.
Gold's reaction would depend partly on real yields and the dollar. Lower real yields would generally reduce the opportunity cost of holding gold, particularly if central-bank demand and geopolitical uncertainty remain elevated.
Scenario 2: Inflation Stays Too High
If inflation remains around 3% or higher while the economy stays resilient, policymakers could keep rates elevated or tighten further. This environment would likely keep Treasury yields important and could continue pressuring highly valued or heavily leveraged assets.
Growth stocks would need stronger earnings to justify high multiples, while small companies would continue facing expensive financing. Bitcoin would compete with meaningful risk-free yields, and housing affordability could remain constrained by elevated mortgage rates.
Gold could struggle if real yields and the dollar rise together, although geopolitical risk and central-bank buying could provide support. This scenario is a good example of why cross-asset relationships need context rather than simple rules.
Scenario 3: Growth Weakens but Inflation Remains High
Stagflation creates a particularly difficult environment because the usual policy responses begin to conflict. A weak economy would normally support rate cuts, while elevated inflation would argue for continued restraint.
Corporate earnings could weaken while borrowing costs remain high, creating pressure on both valuations and fundamentals. Credit-sensitive companies could become especially vulnerable if lenders begin demanding larger risk premiums.
Gold may become more attractive if investors seek protection from monetary or geopolitical uncertainty, but higher real yields could still limit the move. Bitcoin's reaction would likely depend on whether markets focus more heavily on weakening growth or expectations for eventual monetary easing.
Scenario 4: The Fed Cuts but Long-Term Yields Stay High
This may be one of the most important scenarios for investors to understand. The Fed can reduce the overnight policy rate while long-term Treasury investors continue demanding elevated yields because of inflation, fiscal borrowing or increased bond supply.
In that environment, headlines could say "the Fed is cutting," while mortgage rates and corporate borrowing costs remain stubbornly high. Stocks that depend heavily on long-duration valuations may receive less support than investors expect.
The bond market therefore has enormous influence over whether monetary easing actually reaches the broader economy. A lower federal funds rate does not guarantee cheap money everywhere else.
Could Rates Stay Structurally Higher Than the 2010s?
For much of the period after the Global Financial Crisis, investors became accustomed to unusually low borrowing costs. The Fed kept rates near zero from December 2008 until late 2015, and it returned to a 0% to 0.25% target during the pandemic.
Long-term history looks very different. The annual average US 10-year Treasury yield was 13.92% in 1981, fell to just 0.89% in 2020, and averaged about 4.29% in 2025.
Nobody knows where the long-run equilibrium will settle, but traders should at least consider the possibility that the 2010s were the exception rather than the template for every future cycle. Structurally higher capital costs would affect stock valuations, government debt, housing, corporate leverage and portfolio construction for years.
Cash Is an Investment Again
One overlooked consequence of higher interest rates is that investors can receive meaningful returns without owning highly volatile assets. When cash yields effectively zero, the incentive to move further out on the risk curve becomes much stronger.
When Treasury bills and other high-quality short-term instruments offer several percentage points of yield, the decision changes. A speculative stock or crypto asset must compete with an alternative that provides income with substantially less price volatility.
This is why the risk-free rate is so important to asset valuation. It represents the baseline return against which other investments are judged.
Interest Rates Are Powerful, but They Are Not Everything
A great company can continue outperforming during a high-rate environment if revenue, earnings and cash flow grow quickly enough. A poorly managed business can collapse during a rate-cutting cycle if its fundamentals deteriorate.
Bitcoin can rally because of adoption, ETF flows or regulatory changes even while rates remain elevated. Gold can rise because of geopolitical uncertainty and central-bank demand even when real yields would normally create a headwind.
Interest rates establish the financial environment, but fundamentals, liquidity, positioning, sentiment and catalysts determine how individual assets behave inside that environment. Understanding both sides of that equation is far more useful than relying on a simple rule such as "rates up means stocks down."
The ChartClub Framework for Reading Rates
When Treasury yields begin moving aggressively, the first question should be why they are moving. A yield increase driven by stronger real economic growth is different from a yield increase caused by an inflation shock or concerns about government borrowing.
The same principle applies when yields fall. Healthy disinflation that allows the Fed to ease can create a very different market environment from collapsing yields caused by recession or financial stress.
Once the cause is understood, the cross-market reaction becomes easier to interpret. That is the difference between seeing a number move on a screen and understanding what the market may be trying to communicate.
Key Takeaways
Interest rates are the price of capital, and changes in that price can affect almost every major financial asset. Higher rates generally increase borrowing costs, make safer investments more competitive and raise the discount rate applied to future cash flows, while lower rates can produce the opposite effects when economic conditions remain stable.
Growth stocks can be especially sensitive because more of their value depends on future earnings, while small caps can feel the impact through financing costs. Bitcoin is influenced through liquidity, risk appetite and opportunity cost, while gold responds heavily to real yields, the dollar, central-bank demand and broader monetary confidence.
The Fed directly influences short-term policy rates, but the bond market determines longer-term yields through supply, demand and expectations. For traders and investors, understanding that distinction is one of the most useful foundations for reading modern markets.
Frequently Asked Questions
How Do Interest Rates Affect Stocks?
Higher interest rates can pressure stocks by increasing the discount rate applied to future earnings and raising corporate borrowing costs. They can also make government bonds and cash more attractive alternatives, meaning investors may demand better expected returns before taking equity risk.
The opposite can happen when rates fall, particularly if inflation is cooling without a major deterioration in economic growth. Lower discount rates and cheaper financing can support equity valuations, although falling rates caused by recession are not automatically bullish.
Why Do Technology Stocks Fall When Rates Rise?
Technology and growth companies often derive a larger portion of their valuation from profits expected several years into the future. Higher discount rates reduce the present value of those distant cash flows, which can make high-multiple growth stocks especially sensitive to Treasury yields.
This does not mean every technology company will fall when rates rise. Strong earnings growth can offset the valuation impact, which is why fundamentals and rates need to be considered together.
How Do Interest Rates Affect Bitcoin?
Higher interest rates increase the return available from safer assets and can tighten liquidity, which may reduce investor appetite for volatile assets such as Bitcoin. IMF research has found evidence that Fed tightening affects crypto through a risk-taking channel similar to equities.
Bitcoin can still behave differently during periods of monetary stress or concerns about currency debasement. Its fixed supply creates a separate monetary narrative that does not fit neatly into conventional stock-valuation models.
Are Higher Interest Rates Bad for Gold?
Higher real interest rates can create a headwind because gold does not pay interest, making income-producing assets relatively more attractive. The dollar can also strengthen when US yields rise, which can add additional pressure.
Gold is influenced by more than rates, however, including central-bank purchases, geopolitical uncertainty, physical demand and concerns about currency or sovereign risk. That is why higher rates do not automatically mean lower gold prices.
Why Do Bond Prices Fall When Rates Rise?
Existing fixed-rate bonds become less attractive when newly issued bonds offer higher yields. Their market prices therefore need to fall until their effective returns become more competitive with current market rates.
The opposite applies when rates decline because older bonds with higher coupons become relatively more valuable. Longer-duration bonds generally experience larger price changes for the same movement in rates.
Does the Fed Control Mortgage Rates?
The Fed does not directly set mortgage rates. Mortgage borrowing costs are influenced by long-term Treasury yields, mortgage-backed securities markets, credit conditions, lender margins and expectations for inflation.
Fed policy still matters because it affects the broader rate environment. The relationship is indirect, which is why mortgage rates can sometimes rise even while the Fed is cutting its overnight rate.
What Treasury Yield Should Stock Traders Watch?
The 10-year Treasury yield is one of the most important benchmarks because it influences long-term borrowing costs and the discount rates used to value financial assets. The 2-year Treasury yield is also useful because it reacts strongly to changing expectations for Federal Reserve policy.
Watching both gives traders a better picture than following either rate in isolation. The relationship between the two also provides information about the yield curve and how markets view future growth and policy.
What Happens When the Fed Cuts Rates?
A Fed cut generally reduces short-term borrowing costs and can eventually loosen financial conditions. Stocks and other risk assets may benefit when cuts occur alongside falling inflation and stable economic growth.
Cuts are less straightforward when they occur because the economy is entering a severe recession or financial crisis. In those environments, weaker earnings and credit stress can initially outweigh the positive effect of lower rates.
What Is a Real Interest Rate?
A simplified real interest rate is the nominal interest rate minus expected inflation. It helps investors estimate the purchasing-power return they may receive after accounting for changes in prices.
Real yields are particularly relevant to gold because they influence the opportunity cost of holding a non-yielding asset. They also matter to longer-duration financial assets because they help determine the real return available on safer investments.
Why Should Day Traders Care About Interest Rates?
Interest rates can change broad market direction, sector leadership, volatility and risk appetite even when a trader never buys a bond. Sudden changes in the 2-year or 10-year Treasury can quickly influence $SPY, $QQQ, $IWM, technology stocks, small caps, gold and crypto.
For day traders, rates provide context rather than a standalone entry signal. Knowing whether the market is repricing inflation, Fed policy or economic growth can make price action easier to understand.
Final Thoughts
Interest rates can sound like a dry macroeconomic subject until you realize they sit underneath almost everything traders and investors watch. They affect what businesses pay to borrow, how investors value future earnings, what homeowners pay for mortgages, how governments finance deficits and how attractive stocks, bonds, cash, Bitcoin and gold look relative to one another.
Today's environment makes that connection especially visible. The Fed's target range is 3.50% to 3.75%, the 10-year Treasury is near 4.78%, 30-year mortgages average 6.71%, PCE inflation is running at 3.7%, and markets are once again debating whether the Fed may need to tighten rather than continue easing.
Those numbers will change, but the underlying relationships will remain useful long after today's market cycle ends. Learning how the price of money moves through financial markets gives traders something more valuable than another prediction: it gives them a framework for understanding why markets are moving.
Trade. Swing. Invest.
Visit ChartClub.io for market education, research, trading tools and a community focused on process, discipline and continuous improvement.
This article is for educational and informational purposes only. It is not financial or investment advice, and it is not a recommendation to buy or sell any security, cryptocurrency or financial instrument. Markets involve risk, and past performance does not guarantee future results.
Sources and Further Reading
Source | Research Used |
Federal Reserve | July 2026 FOMC decision and current target range. Federal Reserve July 2026 FOMC Statement |
Federal Reserve | Historical federal funds rate changes from 2020 through 2026. Federal Reserve Policy Rate History |
Federal Reserve History | Volcker-era rate increases and inflation decline. Federal Reserve History: 1978-79 Oil Shock and Volcker |
Federal Reserve History | Rate cuts during the Global Financial Crisis. Federal Reserve History: The Great Recession |
BEA | July 2026 headline and core PCE inflation. BEA Personal Income and Outlays, July 2026 |
BLS | August 2026 employment report. BLS Employment Situation, August 2026 |
Freddie Mac | Current mortgage rates and payment examples. Freddie Mac Mortgage Rates |
Congressional Budget Office | Federal deficits, debt and net interest projections through 2036. CBO Budget and Economic Outlook 2026-2036 |
IMF | Research on US monetary policy and crypto-market risk taking. IMF: The Crypto Cycle and US Monetary Policy |
World Gold Council | 2026 gold outlook, real yields and central-bank demand. World Gold Council 2026 Mid-Year Outlook |
World Gold Council | Q2 2026 central-bank gold purchases. World Gold Council Q2 2026 Central Bank Demand |
FDIC | Banking-sector unrealized securities losses during the 2022 rate shock. FDIC Fourth Quarter 2022 Banking Profile |
FRED | Long-run history of the US 10-year Treasury yield. FRED 10-Year Treasury Yield History |
Nasdaq | Nasdaq-100 and S&P 500 historical total returns, including 2020 and 2022. Nasdaq Historical Index Performance |
Reuters | September 4, 2026 cross-market reaction to the US jobs report. Reuters: Yields and Dollar Rise After Jobs Report |
Federal Reserve | September 15-16, 2026 FOMC meeting schedule. Federal Reserve FOMC Calendar |