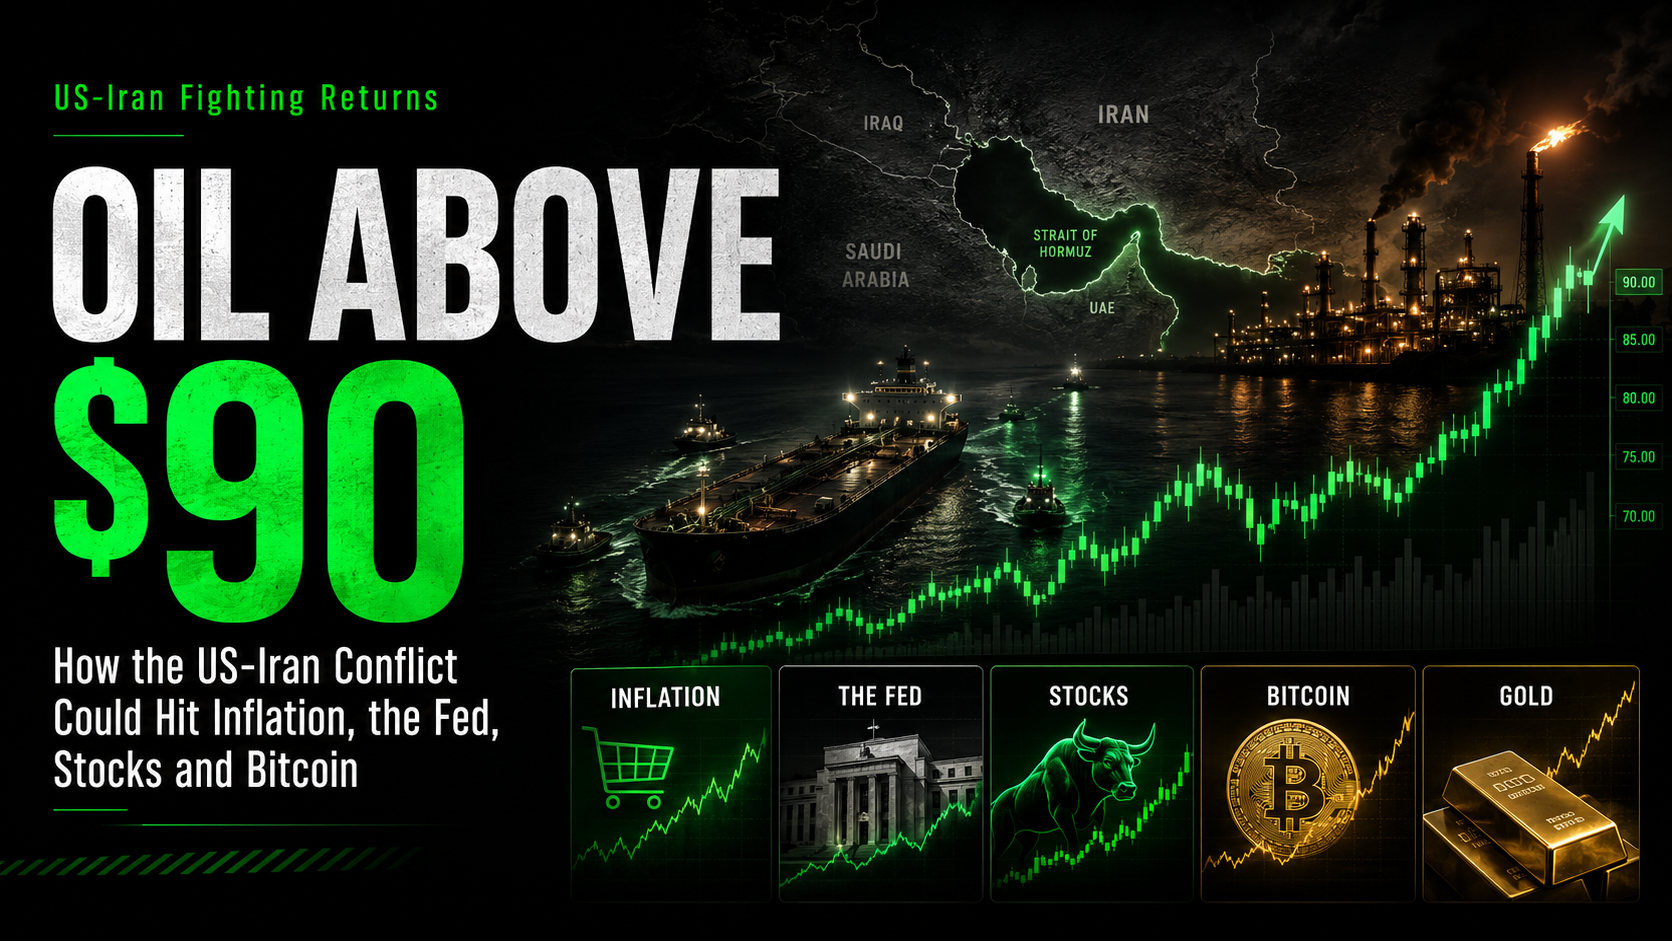
Oil Above $90: How the US-Iran Conflict Could Hit Inflation, the Fed, Stocks and Bitcoin
Renewed US-Iran fighting has pushed Brent crude back above $90. But the bigger story is what an energy shock could mean for inflation, Fed rates, Treasury yields, stocks, Bitcoin, gold and consumers.
Oil Above $90: How the US-Iran Conflict Could Hit Inflation, the Fed, Stocks and Bitcoin
Oil is back above $90.
And this time, it is arriving at a particularly uncomfortable moment for financial markets.
Renewed fighting between the United States and Iran sent Brent crude sharply higher Monday after US forces struck two Iranian launchers on Larak Island, which sits directly inside the Strait of Hormuz.
Iran subsequently said it retaliated against US-linked military positions in Jordan.
Brent crude surged as high as approximately $91.52 per barrel, while US West Texas Intermediate crude moved toward $86 per barrel. The renewed fighting comes roughly six months into a conflict that has already created what the International Energy Agency calls the largest oil-supply disruption in the history of the global market.
But the biggest market risk is not simply that crude oil crossed $90.
It is that another energy shock is arriving just days after Federal Reserve Chair Kevin Warsh warned that inflation remains too high and pushed expectations for another US interest-rate increase sharply higher.
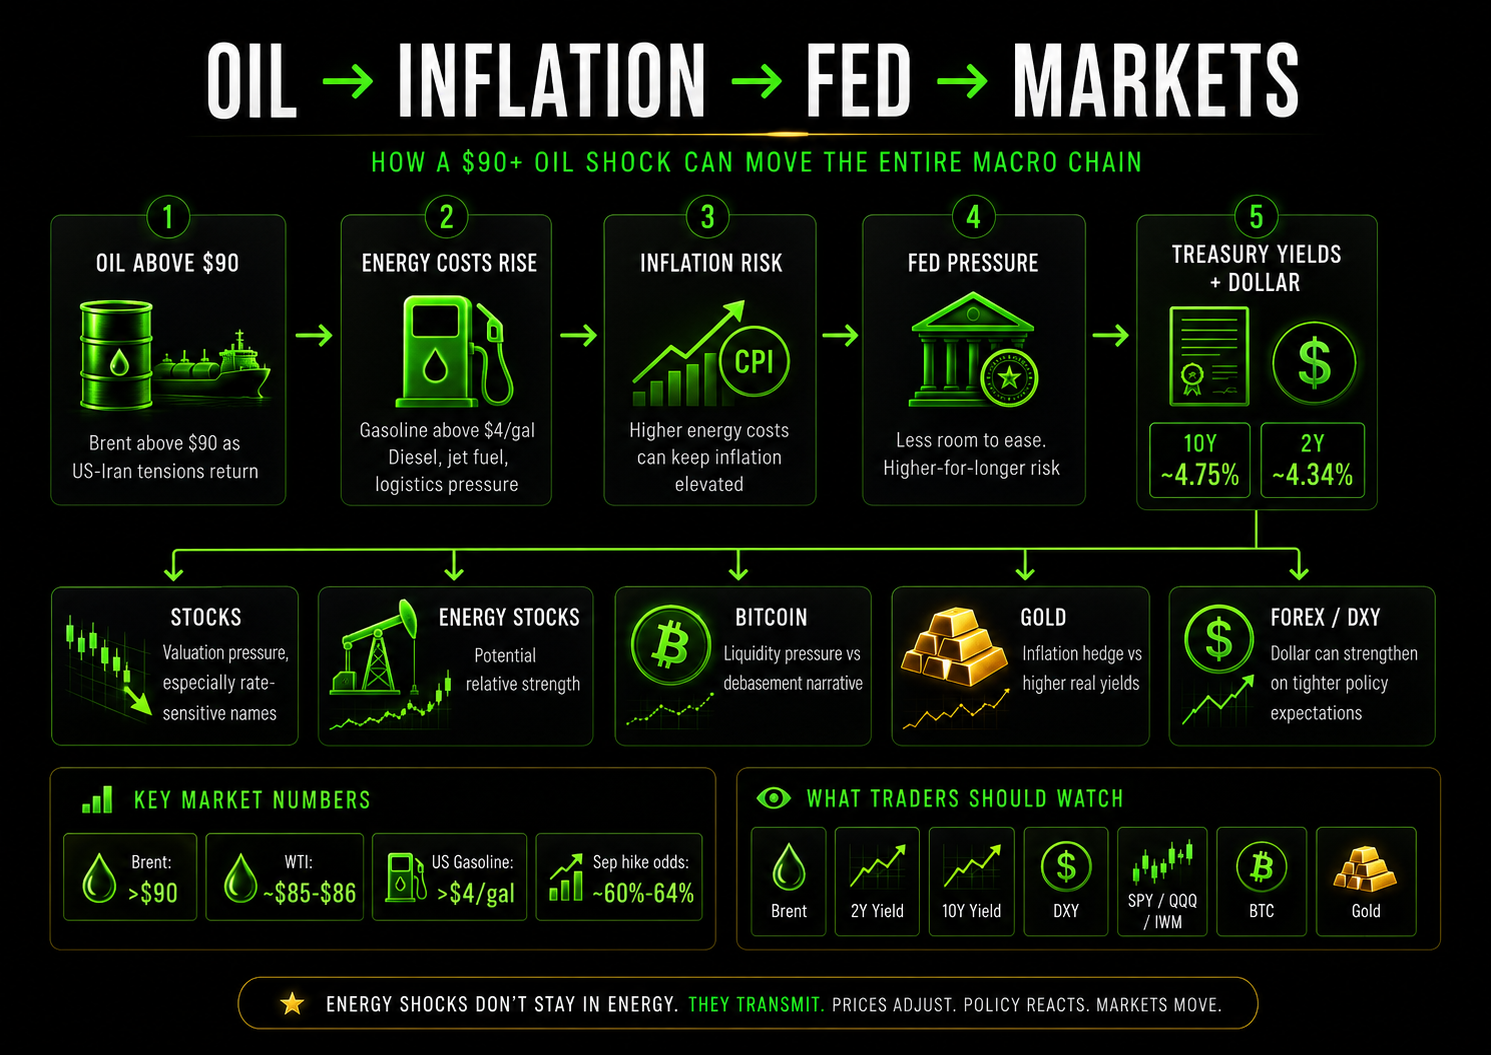
That creates a potentially powerful chain:
US-Iran conflict
↓
Oil above $90
↓
Higher energy costs
↓
More inflation pressure
↓
Less room for the Fed to ease
↓
Higher Treasury yields
↓
Pressure on stocks, crypto and consumers
Oil traders are watching Hormuz.
Bond traders are watching inflation.
Equity traders are watching yields.
Crypto traders are watching liquidity.
And consumers are already paying more at the pump.
This is no longer just an energy story.
It is becoming a whole-market story.
What Happened Between the US and Iran?
The immediate catalyst came over the weekend.
US forces struck two Iranian rocket launchers on Larak Island, near the strategically critical Strait of Hormuz.
According to US officials, the launchers posed a threat to international shipping and American forces.
Iranian state media later reported that Iran's Revolutionary Guards retaliated against US military positions in Jordan.
The exchange represented the first direct US military action against Iran in roughly a month and renewed fears that a period of relative stabilization could be ending.
For oil markets, the location of the strike matters almost as much as the strike itself.
Larak Island sits in the Strait of Hormuz.
And Hormuz may be the most economically important stretch of water on Earth.
Why the Strait of Hormuz Matters So Much
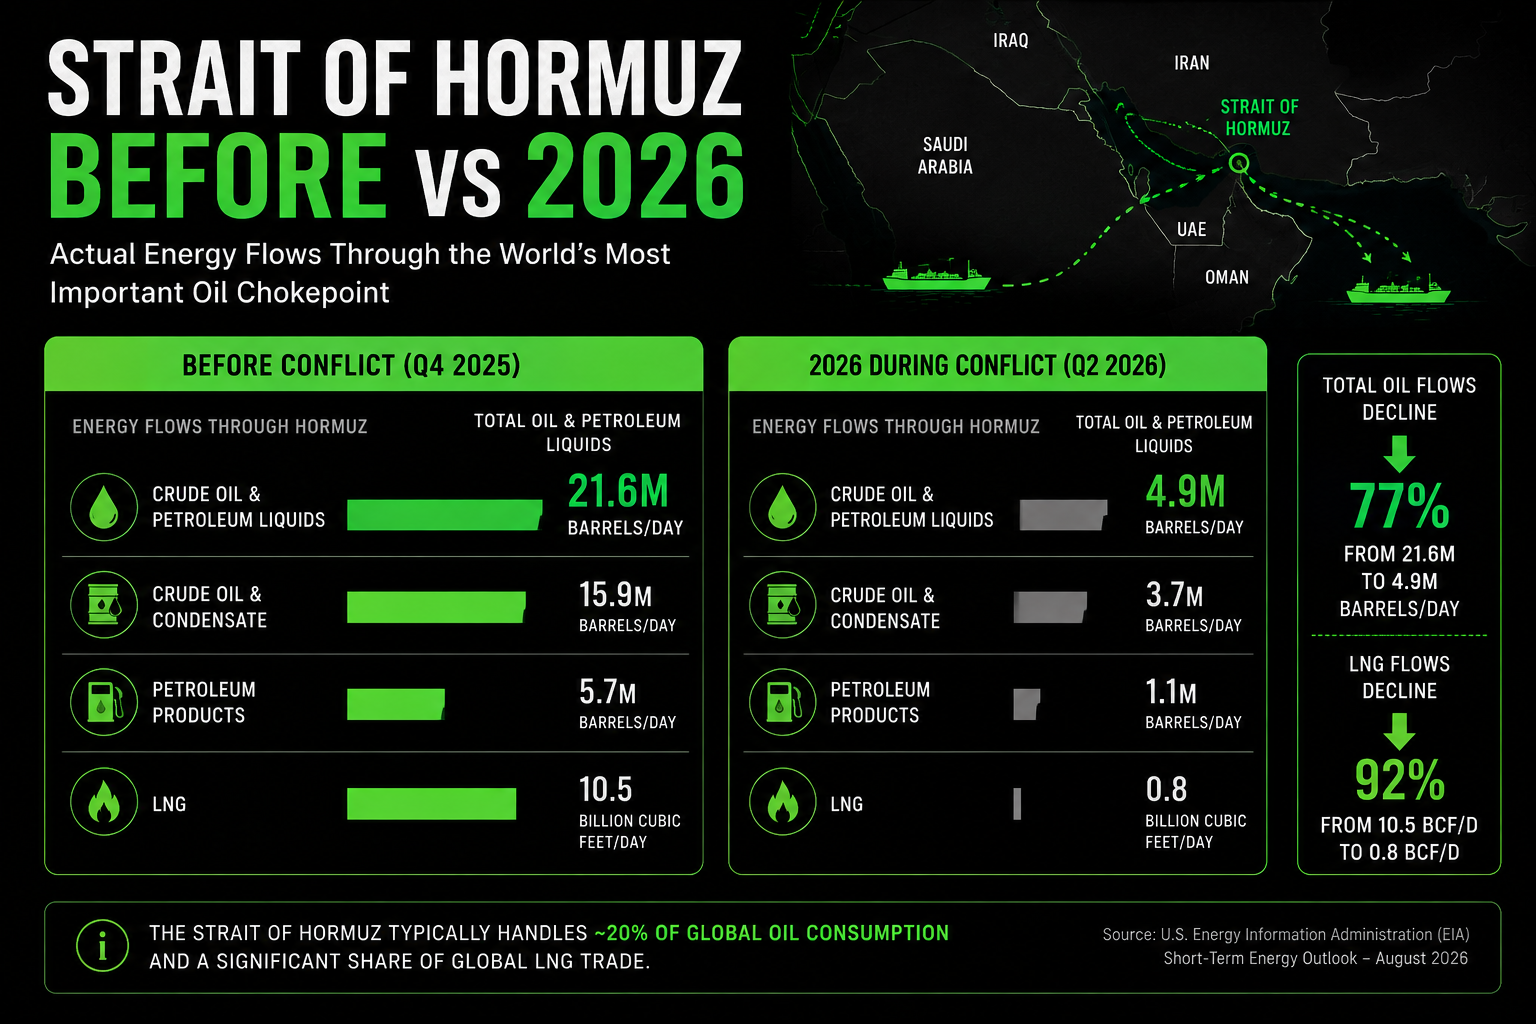
Before the current conflict, the Strait of Hormuz carried approximately 20% of global oil consumption.
The US Energy Information Administration estimates that in the fourth quarter of 2025, approximately:
Energy Flow Through Hormuz Q4 2025 Total crude oil and petroleum liquids 21.6M barrels/day Crude and condensate 15.9M barrels/day Petroleum products 5.7M barrels/day LNG 10.5 billion cubic feet/day
Then the war changed everything.
By the second quarter of 2026, total crude oil and petroleum-liquid flows through Hormuz had fallen to approximately:
4.9 million barrels per day
That is down from 21.6 million barrels per day before the conflict.
It represents a decline of roughly 77%.
That is an extraordinary disruption.
The market is not simply adding a theoretical "war premium" to oil because traders are nervous.
A major portion of actual physical energy supply has already been displaced.
This Is the Largest Oil-Supply Disruption on Record
The International Energy Agency has gone even further.
It describes the Middle East conflict as:
the largest supply disruption in the history of the global oil market.
The IEA estimates Gulf producers have been forced to reduce oil production by at least 10 million barrels per day because of disrupted infrastructure, reduced shipping through Hormuz and limited storage capacity.
That makes the current crisis larger in terms of offline supply than the 1973 oil shock, the event that ultimately helped lead to the creation of the IEA itself.
That historical comparison matters.
Oil shocks have a long record of reshaping inflation, monetary policy and financial markets.
We will come back to that.
The Supply Numbers Are Still Ugly
The IEA's August Oil Market Report shows just how much strain remains underneath the surface.
Global oil supply increased somewhat in July but remained 6.3 million barrels per day below year-earlier levels.
Approximately 8.3 million barrels per day of Gulf production remained offline.
The agency now expects global oil supply to decline by approximately:
4.3 million barrels per day in 2026
It also forecasts a global oil-market deficit of roughly:
1.8 million barrels per day in Q3
Meanwhile, observed global oil inventories fell by another 69 million barrels in July.
The cumulative draw since the conflict began is even more striking.
Approximately 410 million barrels have disappeared from observed global oil inventories since the end of February.
Total observed inventories fell below 7.9 billion barrels for the first time since April 2025.
That matters because inventories act as a buffer.
When supply is disrupted, inventories can temporarily prevent prices from exploding.
But inventories cannot be drawn forever.
There Is No Easy Way Around Hormuz
One obvious question is:
Why not just send the oil through pipelines?
Some of it can be.
Most of it cannot.
The International Energy Agency estimates that Saudi Arabia and the United Arab Emirates have roughly 3.5 million to 5.5 million barrels per day of available pipeline capacity capable of bypassing the Strait of Hormuz.
Compare that with more than 20 million barrels per day that historically moved through Hormuz.
Even at the upper end of the estimate, existing alternative pipelines could replace only about one-quarter of normal Hormuz oil traffic.
Saudi Arabia has its East-West pipeline toward the Red Sea.
The UAE has the Abu Dhabi Crude Oil Pipeline running toward Fujairah.
But there is no magic pipeline capable of replacing Hormuz.
And the LNG problem is even more difficult.
Qatar, one of the world's largest LNG exporters, does not have an equivalent large-scale land route allowing its normal exports to simply bypass the Strait.
So Why Isn't Oil at $150?
This is one of the most interesting questions in the entire story.
If the world is experiencing the largest physical supply disruption on record, why is Brent crude trading around $90 instead of $120, $150 or even higher?
The answer is:
Demand.
The same energy shock that removed supply has also damaged consumption.
The IEA currently forecasts global oil demand to decline by approximately:
1.6 million barrels per day in 2026
Demand contracted an estimated 4.9 million barrels per day in Q2, with the decline expected to moderate to around 2.8 million barrels per day during Q3.
China has been a major part of that weakness.
Reuters reports Chinese crude imports reached a near decade low in June, while July imports remained approximately 24.3% below the previous year.
So two enormous forces are fighting each other:
Supply Shock
versus
Demand Destruction
That battle helps explain why crude oil has experienced extraordinary volatility rather than simply moving straight higher.
Oil Has Already Been Much Higher During This War
Today's move above $90 is important.
But it is not unprecedented even within the current conflict.
In March, as the war escalated and fears around Hormuz intensified:
Brent crude closed at $112.78 per barrel.
WTI closed at $102.88 per barrel.
Brent rose approximately:
57% during March alone
Its strongest monthly gain since the 1990 Gulf War.
WTI gained approximately 53% during the month.
So $90 should not automatically be treated as an extreme ceiling.
The market has already shown it can trade significantly higher if physical supply conditions deteriorate.
Oil Shocks Have Changed Economies Before
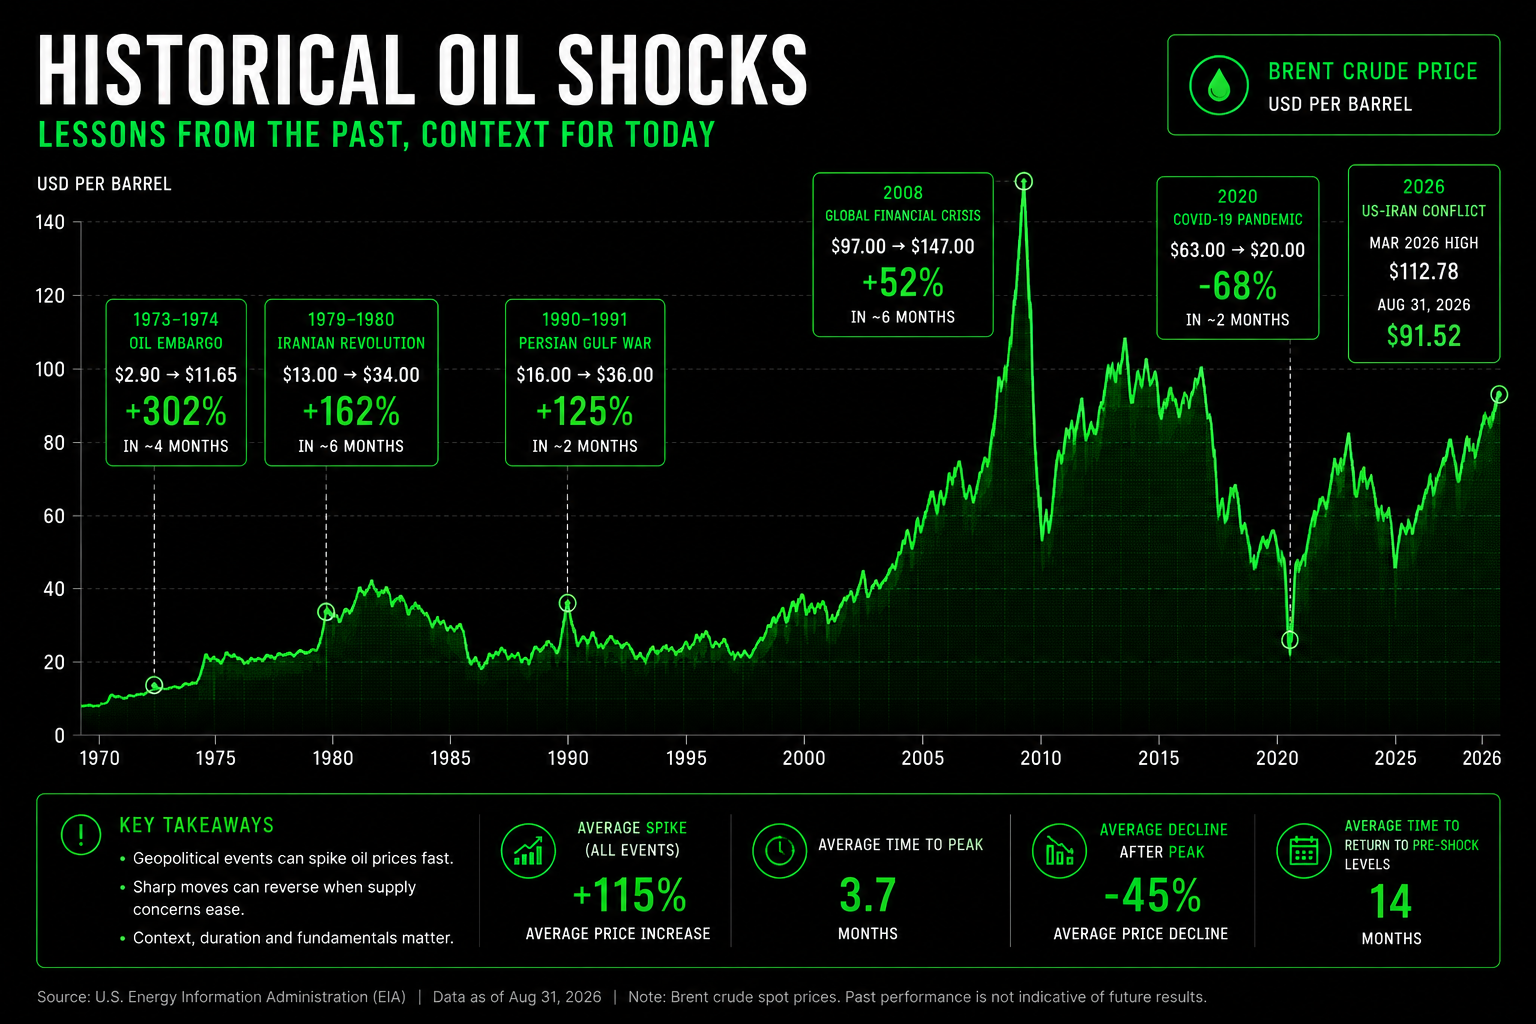
There is a reason policymakers take energy shocks seriously.
1973 Oil Embargo
During the 1973 Arab oil embargo, crude prices rose from approximately:
$2.90 per barrel
to
$11.65 per barrel
by January 1974.
That was nearly a 4X increase in just a few months.
The shock helped worsen inflation and economic weakness simultaneously.
That combination contributed to the period eventually remembered as stagflation.
1990 Gulf War
When Iraq invaded Kuwait in August 1990, crude prices quickly jumped from around $16 per barrel to more than $28.
By September, prices reached roughly:
$36 per barrel
according to historical EIA data.
Prices eventually fell as concerns around long-term supply disruptions eased.
That is an important lesson for today.
Geopolitical oil spikes can reverse extremely quickly when the perceived threat to physical supply changes.
2026 Iran Conflict
This year has already delivered another historic shock.
Brent's roughly 57% March surge was its strongest monthly increase since the 1990 Gulf crisis.
The names change.
The market mechanism does not.
Supply disruption → higher energy prices → inflation → economic pressure → policy response
America's Emergency Oil Buffer Is Running Low
The United States normally has another weapon against major oil shocks.
The Strategic Petroleum Reserve, or SPR.
But that buffer has become significantly weaker.
US government data show the SPR currently holds approximately:
289.7 million barrels
That is the lowest level since 1982.
And it could fall further.
An additional planned emergency release could eventually reduce the reserve toward approximately:
243 million barrels
Reuters reports experts have raised concerns about pushing inventories much below approximately 250 million barrels, not simply because of how much oil remains, but because of operational constraints involving storage caverns, pipelines and pumping systems.
This is important.
The SPR still exists.
The United States could still authorize emergency releases.
But Washington has less flexibility than it would have with a fully stocked reserve.
Why Is the SPR So Low?
The reserve has been tapped repeatedly during recent energy crises.
The United States contributed roughly 172 million barrels to the IEA's enormous emergency response following the start of the current Middle East conflict.
Earlier emergency releases, including those associated with Russia's invasion of Ukraine, had already reduced inventories significantly.
Now the White House says it intends to replenish the SPR using Venezuelan oil under a new agreement with Caracas.
The problem is timing.
Even if substantial Venezuelan supply eventually comes online, infrastructure investment and production expansion take time.
Oil cannot simply be produced because a political agreement is signed.
That leaves the United States facing today's energy crisis with a strategic reserve sitting near a 44-year low.
Consumers Are Already Feeling the Oil Shock
For households, crude oil futures can feel abstract.
Gasoline prices do not.
US gasoline remained above $4 per gallon throughout August, making this the most expensive August on record.
The national average has recently been around:
$4.08 per gallon
according to current reporting.
That matters because gasoline prices function almost like a tax on consumers.
A household spending another $40, $60 or $100 per month on fuel has less money available for:
restaurants,
travel,
clothing,
entertainment,
electronics,
and other discretionary spending.
This is how an oil shock eventually reaches corporate earnings.
Not every company consumes crude oil directly.
Nearly every economy consumes energy.
The Bigger Problem May Be Diesel and Jet Fuel
Crude oil gets the headlines.
Refined products may create an even larger economic problem.
The IEA reports global refinery throughput remained almost:
5 million barrels per day below year-earlier levels
during July.
Seaborne petroleum-product trade was approximately 3.8 million barrels per day lower YoY.
Diesel exports from Russia, the Middle East and Asia declined around:
1.3 million barrels per day
That is equivalent to roughly 20% of global seaborne diesel trade.
Jet-fuel exports from those regions were down approximately:
670,000 barrels per day
or around 34% of global seaborne jet-fuel trade.
That can affect:
trucking,
aviation,
shipping,
agriculture,
manufacturing,
construction,
food distribution,
and eventually consumer prices.
The inflation impact therefore extends far beyond the price displayed at a gas station.
Why $90 Oil Matters for Inflation
Energy feeds through the economy in several ways.
The obvious one is gasoline.
But businesses also pay more for:
transportation,
electricity,
petrochemicals,
shipping,
aviation,
fertilizer,
packaging,
manufacturing,
and logistics.
Companies then face a choice.
Absorb those costs and accept lower margins.
Or pass some of them to customers.
That is where the Federal Reserve enters the story.
US headline PCE inflation is already running at approximately:
3.7%
The Fed's target is:
2%
The inflation battle was already unfinished before oil moved back above $90.
Now energy could make it harder.
The Timing Could Not Be Worse for the Fed
Federal Reserve Chair Kevin Warsh used Jackson Hole to warn markets that underlying inflation has not improved enough.
His comments caused traders to dramatically increase expectations for another rate hike.
Before Jackson Hole, markets were pricing approximately a 35% chance of a September hike.
By Monday, that probability had increased into roughly the:
60% to 64% range
depending on the point in the session measured.
Then oil surged again.
That creates an uncomfortable situation.
The Fed is already worried about inflation.
Now another inflation-sensitive commodity is rising.
The transmission chain is straightforward:
Oil rises
↓
Energy costs rise
↓
Inflation risk increases
↓
Fed may need tighter policy
↓
Treasury yields rise
↓
Financial conditions tighten
This is why oil traders and stock traders suddenly care about the same story.
Treasury Yields Are Already Reacting
Monday's bond market showed that investors are paying attention.
The US 10-year Treasury yield moved toward roughly 4.75%.
The policy-sensitive 2-year yield traded around 4.34%.
These are important levels.
Higher Treasury yields increase the cost of:
mortgages,
corporate debt,
auto loans,
government borrowing,
and refinancing.
They also affect stock valuations.
A company does not suddenly earn less money because the 10-year Treasury rises.
But investors now have a higher return available from relatively low-risk government debt.
Stocks therefore have to compete harder for capital.
How Higher Oil Can Hit the Stock Market
An oil shock does not affect every stock equally.
There are winners.
There are losers.
And there are businesses sitting somewhere in between.
Potential Beneficiaries: Energy
The most obvious beneficiaries are companies producing oil and providing energy services.
Energy stocks moved higher Monday as crude climbed.
The Energy Select Sector SPDR Fund, $XLE, rose around 1.4% early in the session, with its components broadly positive.
Names traders may watch include:
$XOM, Exxon Mobil $CVX, Chevron $COP, ConocoPhillips $OXY, Occidental Petroleum $SLB $HAL, Halliburton
Higher crude prices can increase realized revenue for producers.
But investors still need to consider company-specific costs, hedging, production volumes and balance sheets.
"Oil up" does not automatically mean every energy stock becomes a good investment.
Airlines and Transportation Face the Opposite Problem
For airlines, higher oil means higher jet-fuel costs.
For trucking companies, it means higher diesel costs.
For logistics businesses, it means more expensive transportation.
Some companies can pass those costs along.
Others cannot.
This can create pressure on:
airlines,
trucking,
delivery companies,
cruise operators,
manufacturers,
and businesses with large transportation networks.
The more persistent the energy shock becomes, the harder it is for companies to simply absorb it.
Small Caps Could Feel It Through Interest Rates
Small-cap companies may not consume much oil directly.
But they tend to be more sensitive to financing conditions.
Higher oil can keep inflation elevated.
Higher inflation can keep Fed policy tighter.
Tighter Fed policy can keep borrowing costs elevated.
Many smaller businesses have:
more floating-rate debt,
higher refinancing requirements,
less predictable cash flow,
and less access to inexpensive capital.
That makes $IWM and the Russell 2000 useful gauges of whether the energy shock is becoming a broader financial-conditions story.
Technology Faces a Valuation Problem
Technology presents a different issue.
The AI boom continues to generate extraordinary earnings growth.
But high-growth companies are also sensitive to interest rates.
Higher Treasury yields increase the discount rate investors apply to future earnings.
So markets could enter a strange tug-of-war:
AI earnings growth
versus
higher oil + higher inflation + higher rates
That battle matters particularly for:
$QQQ
$NVDA
$AVGO
and the broader semiconductor and technology complex.
Why Bitcoin Is Part of the Oil Story
Bitcoin may seem disconnected from oil.
It is not.
BTC has been trading near $78,000 to $79,000, below the $80,000 level it recently broke above.
Oil can affect Bitcoin indirectly through the macro chain:
Oil ↑
↓
Inflation expectations ↑
↓
Fed expectations ↑
↓
Treasury yields ↑
↓
Dollar / real yields potentially ↑
↓
Liquidity conditions tighten
↓
Bitcoin faces pressure
This is one reason BTC weakened following Warsh's Jackson Hole speech.
Bitcoin still trades partly as a liquidity-sensitive risk asset.
But Bitcoin Has Another Narrative
There is an important complication.
Bitcoin also increasingly trades as an alternative monetary asset.
War can create:
larger government spending,
higher deficits,
economic intervention,
emergency reserve releases,
currency concerns,
and questions about long-term monetary credibility.
Those forces can support the idea of Bitcoin as a scarce asset outside the traditional monetary system.
So BTC is caught between two competing narratives.
Short Term
Higher inflation and tighter monetary policy can hurt liquidity.
Long Term
Fiscal deterioration and currency-debasement concerns can strengthen Bitcoin's monetary narrative.
That tension is why Bitcoin's response to geopolitical shocks is often far less predictable than:
War = Bitcoin up.
Gold Is Fighting the Same Battle
Gold was trading around $4,455 per ounce Monday after dropping around 3% Friday, its biggest single-day decline since June.
Yet gold remained up more than 10% for August.
Gold benefits from:
geopolitical uncertainty,
inflation concerns,
government debt worries,
and demand for alternative stores of value.
But gold pays no interest.
If oil pushes the Fed toward tighter policy and Treasury yields rise, the opportunity cost of holding gold rises too.
That creates almost the same tug-of-war we see in Bitcoin.
Geopolitical risk supports gold.
Higher real yields pressure gold.
The market decides which force matters more.
Why Stocks Have Been Surprisingly Resilient
With all of this happening, it would be reasonable to expect a major equity collapse.
That has not happened.
US equities opened only modestly lower Monday.
The S&P 500, Dow and Nasdaq initially fell by a few tenths of a percent rather than experiencing panic selling.
The broader 2026 market has also remained surprisingly resilient despite months of Middle East conflict.
Reuters notes that global equities have continued receiving support from strong corporate earnings and enormous AI investment even while oil markets remain disrupted.
That tells us something important.
Markets are not pricing:
"War = sell everything."
They are pricing competing variables.
Growth.
Profits.
Interest rates.
Oil.
Inflation.
AI.
Fiscal policy.
Liquidity.
Valuations.
That is why traders should never assume the market's reaction simply because a headline sounds scary.
The Strategic Petroleum Reserve Changes the Policy Equation
The SPR deserves special attention because it limits how aggressively Washington can respond to another oil spike.
At roughly 289.7 million barrels, the reserve is already near a 44-year low.
If oil moves toward $100 again, policymakers may face an uncomfortable choice:
Release more emergency oil and further reduce the strategic buffer.
Or tolerate higher energy prices and allow demand destruction to rebalance the market.
That second option is economically painful.
Consumers drive less.
Businesses reduce activity.
Airlines cut capacity.
Manufacturers conserve energy.
Eventually demand falls enough to match constrained supply.
That is how markets rebalance without additional production.
It works.
But it is not pleasant.
Can OPEC+ Rescue the Market?
OPEC+ is another key piece of the equation.
Seven participating countries agreed earlier this month to implement a 188,000 barrel-per-day production adjustment for September.
Their next meeting is scheduled for:
September 6, 2026
Normally, traders might expect OPEC+ to respond aggressively to a supply shock.
But this crisis is unusual.
A significant amount of Gulf production itself has been disrupted.
And alternative export routes remain constrained.
Increasing the amount of oil produced inland does not solve much if that oil cannot efficiently reach global markets.
That makes the Hormuz shipping situation more important than a headline production quota alone.
$100 Oil Is Back on the Table
Nobody knows exactly where crude trades next.
But the scenario matters.
Brent already reached $112.78 earlier this year.
So a return to $100 would not require the market to enter completely uncharted territory.
Three broad scenarios make sense.
Scenario 1: De-escalation
Iran-Oman negotiations make progress.
Shipping traffic improves.
No additional significant military attacks occur.
Under that outcome, geopolitical risk premium could fall rapidly.
Oil could retreat toward the high-$80s or potentially below.
This is why traders should not blindly chase crude after geopolitical spikes.
Scenario 2: Persistent Tension
Hormuz remains restricted.
Some shipping continues.
Military attacks remain contained.
Diplomatic talks continue without a major breakthrough.
This could keep Brent structurally elevated in roughly the high-$80s to mid-$90s.
A Reuters survey of 31 economists and analysts currently forecasts average 2026 prices of:
Brent: $85.08
WTI: $80.20
That represents a market expecting continued disruption without a complete collapse in Gulf exports.
Scenario 3: Major Escalation
More tankers are attacked.
Energy infrastructure is damaged.
Hormuz restrictions intensify.
The conflict spreads further across the region.
Then traders would likely begin looking toward:
$100 Brent
and potentially the earlier 2026 highs above:
$110
The macro implications become substantially larger at that point.
What Happens If Oil Goes Back Above $100?
A sustained move through $100 would likely matter much more than a brief intraday spike.
Consumers could face another round of gasoline increases.
Airlines and transportation businesses could see margins pressured.
Inflation expectations could rise.
The Fed's September decision could become more difficult.
Treasury yields could remain elevated.
Small caps and highly leveraged companies could face tougher financing conditions.
Energy producers could outperform.
Bitcoin and gold could face conflicting signals between tighter liquidity and monetary/fiscal concerns.
This is where one commodity starts affecting the entire market.
The Demand Side Could Still Stop the Rally
There is a strong bearish argument for oil too.
Global demand is weakening.
The IEA expects 2026 consumption to decline 1.6 million barrels per day.
China is importing substantially less crude.
High gasoline and diesel prices discourage consumption.
Businesses react to higher transportation costs.
Economic growth can slow.
Eventually, expensive oil destroys some of its own demand.
This is why oil traders need to track more than missiles and tankers.
If economic activity weakens sharply enough, crude can fall even while geopolitical tensions remain unresolved.
Supply Shock vs Demand Destruction
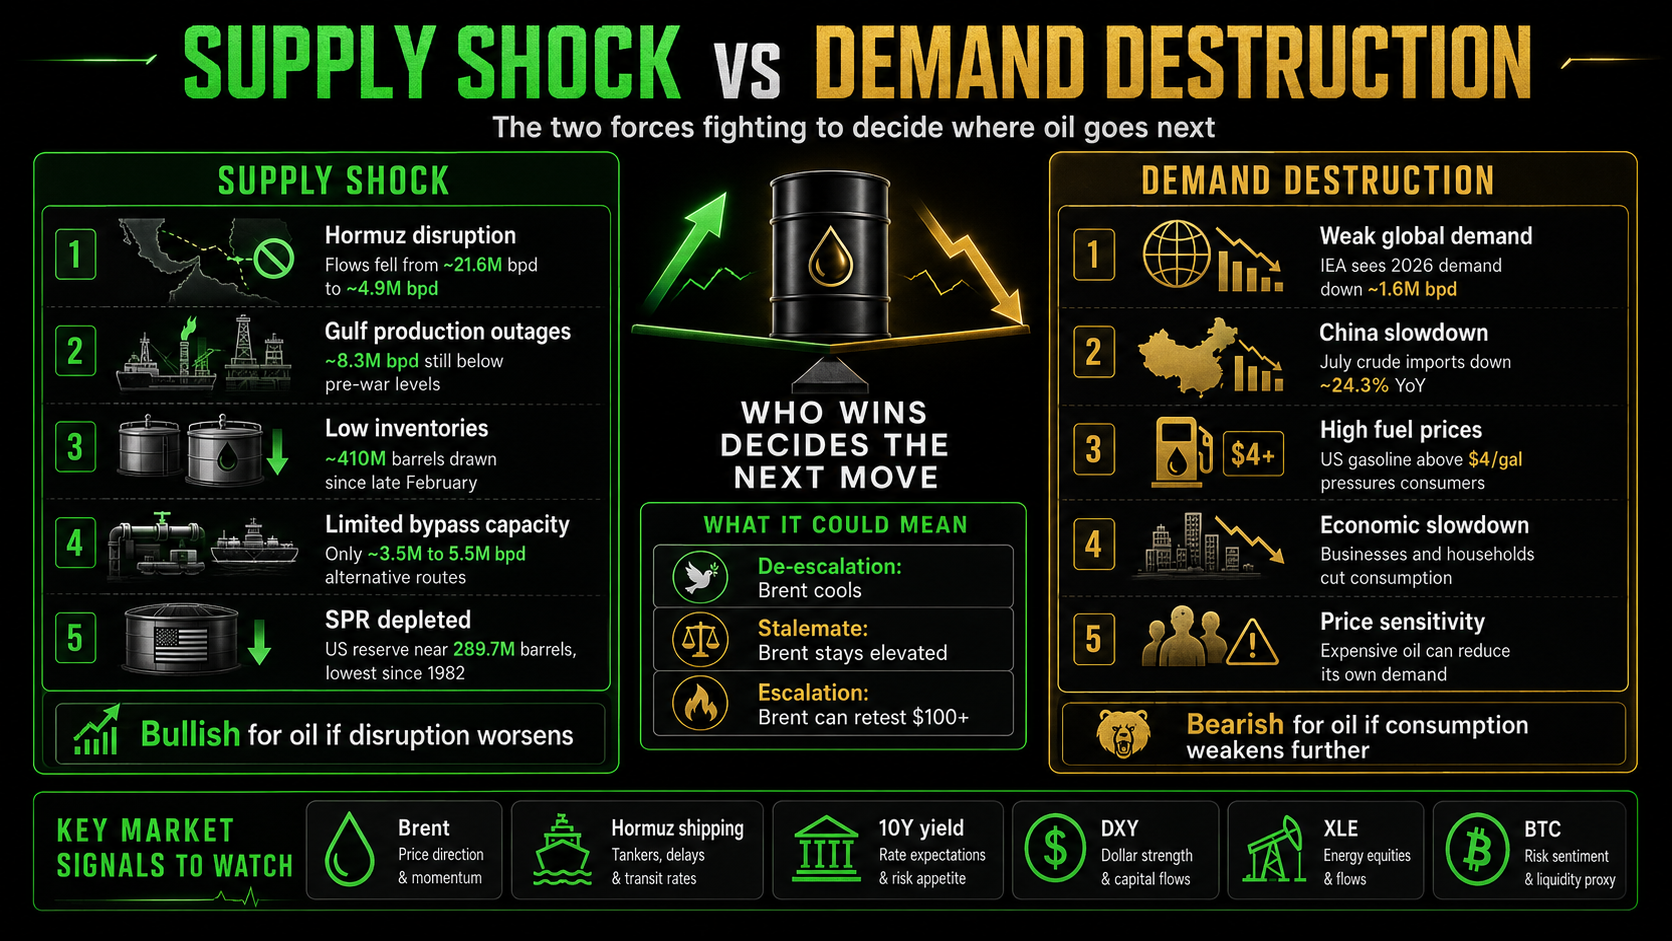
That is the central oil-market battle of 2026.
On one side:
Hormuz disruption
Gulf production outages
Tankers under threat
Low inventories
Limited bypass capacity
A depleted US SPR
On the other:
Weak Chinese demand
Falling global consumption
High consumer fuel prices
Economic slowdown
Demand destruction
Whichever force dominates will determine whether Brent moves toward:
$80
$100
or back toward the year's highs above $110.
What Traders Should Watch Next
There are several catalysts that could quickly change the oil thesis.
- Strait of Hormuz Shipping
This is arguably the most important indicator.
More ships passing safely through Hormuz would be bearish for the geopolitical risk premium.
Another sharp deterioration would be bullish for crude.
- Additional US-Iran Military Strikes
Watch whether the current exchange remains isolated or turns into another sustained round of attacks.
- Tanker Incidents
Commercial-vessel attacks can immediately affect insurance costs, shipping behavior and the market's perception of available supply.
- Iran-Oman Negotiations
Diplomacy matters.
A credible agreement creating safer shipping conditions could move oil dramatically lower even if the broader conflict remains unresolved.
- New US Sanctions
Treasury Secretary Scott Bessent says Washington expects to unveil new secondary sanctions against Iran on a weekly basis, initially targeting financial institutions.
- OPEC+
The next OPEC+ meeting arrives September 6.
- US Jobs Report
The August employment report arrives September 4.
A strong report combined with expensive oil could strengthen the case for tighter Fed policy.
- August CPI
Inflation data arrive September 11.
That report could show whether the energy shock is beginning to complicate the inflation picture.
- September Fed Meeting
The FOMC meets September 15-16.
Oil is now another variable policymakers need to consider.
What Traders Should Watch Across Markets
The oil story should not be analyzed in isolation.
Crude Oil
Brent $90 is now an obvious psychological level.
WTI Watch whether US crude can establish itself above the mid-$80s.
Energy Stocks
$XLE $XOM $CVX $COP $OXY $SLB $HAL
Look for relative strength if oil remains elevated.
Broad Market
$SPY
Can the market absorb higher oil without losing its broader uptrend?
Technology
$QQQ
Watch the relationship between rising Treasury yields and AI-driven earnings strength.
Small Caps
$IWM
Higher rates and financing pressure could matter more here than for cash-rich mega caps.
Bitcoin
$BTC
The $80,000 area remains psychologically important.
Gold
Watch whether geopolitical demand begins overpowering the headwind from higher real yields.
Bonds
The 2-year and 10-year Treasury yields provide an important read on whether markets see oil primarily as an inflation problem.
US Dollar
DXY can help confirm whether markets are repricing tighter US monetary policy.
One Important Warning: Separate Confirmed Facts From Viral Claims
Geopolitical markets are perfect environments for misinformation.
One example emerged immediately during this latest escalation.
President Trump circulated imagery and comments suggesting Iran's Kharg Island energy hub was being heavily attacked.
Reuters reported there was no independent evidence confirming an attack on Kharg Island, while Iran said oil operations there continued.
The confirmed US strikes involved launchers on Larak Island.
That distinction matters.
A trader reacting to an unverified social-media post about the destruction of major oil infrastructure can make a very expensive mistake.
During geopolitical events:
verify first, trade second.
Historical Oil Shocks Give Traders Another Lesson
The 1973 oil embargo.
The 1990 Gulf War.
Russia's invasion of Ukraine.
And now the 2026 US-Iran conflict.
Each crisis was different.
But one pattern repeatedly appears.
Oil prices can rise incredibly fast when physical supply becomes uncertain.
They can also fall incredibly fast once that uncertainty changes.
That makes crude one of the clearest examples of why:
a catalyst is not the same thing as a permanent trend.
The market is constantly repricing probabilities.
Will Hormuz reopen?
Will another tanker be attacked?
Will OPEC increase output?
Will global demand collapse?
Will the war expand?
Will diplomacy work?
Oil prices represent the market's constantly changing answer to those questions.
What This Means for Investors
Long-term investors should think beyond whether Brent trades at $92 tomorrow.
The more important question is whether energy remains structurally expensive.
If oil remains elevated for months, it can reshape:
corporate margins,
consumer spending,
inflation,
interest rates,
government policy,
and investment returns.
Companies with:
strong balance sheets,
pricing power,
high margins,
low energy intensity,
and consistent cash generation
may be better positioned.
Highly leveraged businesses with little pricing power and heavy fuel exposure could face a more difficult environment.
Energy producers may benefit financially, but they also carry significant commodity and geopolitical risk.
The regime matters more than one day's price.
ChartClub Takeaway: Oil Is Now Part of the Fed Trade
This is the most important takeaway.
The renewed US-Iran fighting matters because it did not happen in isolation.
It arrived immediately after the Federal Reserve became more hawkish.
Inflation is already around 3.7%.
Markets already price a meaningful probability of another September rate increase.
Treasury yields are already elevated.
Bitcoin has already slipped below $80,000.
Gold is already wrestling with higher real rates.
Consumers are already paying more than $4 per gallon for gasoline.
And the Strategic Petroleum Reserve is already near its lowest level since 1982.
Now Brent crude is back above $90.
That creates a very different macro environment than traders faced even a few weeks ago.
The market is no longer asking only:
How bad is the Iran conflict?
It is asking:
What does the Iran conflict do to inflation?
What does inflation do to the Fed?
What does the Fed do to yields?
And what do higher yields do to everything else?
That is how markets connect.
Final Thoughts
Oil above $90 is not automatically a crisis.
But the underlying setup deserves attention.
The Strait of Hormuz historically carried more than 20 million barrels per day of crude and petroleum liquids.
Q2 flows collapsed to roughly 4.9 million barrels per day.
The IEA calls the disruption the largest in oil-market history.
Gulf production remains heavily constrained.
Global inventories have fallen approximately 410 million barrels since the conflict began.
America's Strategic Petroleum Reserve sits at roughly 289.7 million barrels, its lowest level in around 44 years.
Gasoline is already above $4 per gallon.
Yet demand destruction is powerful enough that Brent remains around $90 instead of returning to the $112.78 level reached earlier this year.
That tells us exactly what the market is fighting over.
Supply is scarce.
Demand is weak.
And now renewed military escalation is testing that balance again.
For traders and investors, the answer is not to predict every missile launch or diplomatic headline.
Watch the data.
Watch Hormuz.
Watch oil.
Watch inflation expectations.
Watch Treasury yields.
Watch the dollar.
Then watch how stocks, Bitcoin and gold respond.
The geopolitical headline creates the catalyst.
The cross-market reaction tells us whether it matters.
Oil Above $90 FAQ Why is oil above $90?
Brent crude moved back above $90 after the United States attacked Iranian military positions on Larak Island near the Strait of Hormuz and Iran reported retaliatory attacks. The renewed fighting increased concerns about already-disrupted Gulf oil shipments.
How much oil normally passes through the Strait of Hormuz?
Before the conflict, approximately 21.6 million barrels per day of crude oil and petroleum liquids moved through Hormuz, according to the US Energy Information Administration. Q2 2026 flows fell to approximately 4.9 million barrels per day.
Could oil return to $100?
It could. Brent already traded above $110 earlier in 2026. Whether it returns to $100 will depend heavily on Hormuz shipping, military escalation, Gulf production, inventories and global demand.
How high did oil get earlier in the Iran conflict?
Brent closed at $112.78 per barrel in late March, while WTI reached $102.88. Brent gained approximately 57% during March, its largest monthly advance since the 1990 Gulf War.
How does higher oil affect inflation?
Higher crude and refined-product prices can increase gasoline, diesel, aviation, transportation, manufacturing and logistics costs. Businesses may pass some of those costs to consumers, contributing to inflation.
Could expensive oil cause the Fed to raise rates?
Oil alone does not determine Federal Reserve policy, but sustained higher energy prices can complicate inflation. Markets currently price a meaningful probability of another September rate increase following Kevin Warsh's hawkish Jackson Hole remarks.
Which stocks benefit from higher oil?
Oil producers and energy-services companies can benefit from higher crude prices. Traders commonly watch $XLE, $XOM, $CVX, $COP, $OXY, $SLB and $HAL. Individual company fundamentals still matter.
Which stocks can be hurt by higher oil?
Airlines, transportation companies, logistics businesses, manufacturers and consumer-facing companies can face higher costs. Small caps and high-growth stocks may also be affected indirectly if higher oil keeps interest rates elevated.
Why does oil matter for Bitcoin?
Oil can influence inflation expectations, Fed policy, Treasury yields and the dollar. These affect global liquidity and risk appetite, which can influence Bitcoin.
Why does oil matter for gold?
Geopolitical risk and inflation can support gold, while higher interest rates and real yields can pressure it. Oil shocks can strengthen both forces simultaneously.
How much oil is currently in the US Strategic Petroleum Reserve?
The SPR recently held approximately 289.7 million barrels, its lowest level since 1982.
When is the next OPEC+ meeting?
The participating OPEC+ countries are scheduled to meet again on September 6, 2026.
Sources and Further Reading
For the strongest version of this article, I would keep these source links visible near the bottom while also hyperlinking key claims throughout the published version.
Reuters: Renewed US-Iran attacks and the oil-price reaction Oil rises over 2% as US and Iran resume military attacks
US Energy Information Administration: Strait of Hormuz flows EIA Short-Term Energy Outlook
International Energy Agency: August Oil Market Report IEA Oil Market Report, August 2026
International Energy Agency: Strait of Hormuz and alternative routes IEA Strait of Hormuz analysis
International Energy Agency: Historical scale of the current supply shock IEA Sheltering From Oil Shocks
Reuters: US Strategic Petroleum Reserve depletion Depleted US oil stash loses potency as Iran war grinds on
Reuters: Current analyst oil-price forecasts Oil expected to remain above $80 as Middle East risks persist
OPEC: September production adjustment and next meeting OPEC August 2026 production announcement
About ChartClub
ChartClub looks beyond individual headlines to understand how catalysts move through markets.
A military escalation can move oil. Oil can move inflation expectations. Inflation can move Treasury yields and Federal Reserve expectations. Those changes can influence stocks, forex, gold and Bitcoin.
Understanding those relationships is what turns breaking news into useful market intelligence.
Trade. Swing. Invest.
Visit www.chartclub.io for market research, trading education, tools and the ChartClub community.
This article is for educational and informational purposes only. It is not financial advice, investment advice or a recommendation to buy or sell any security, cryptocurrency, commodity or financial instrument. Markets involve risk and past performance does not guarantee future results.